Too many indicators
When everything is measured, it becomes difficult to distinguish meaningful signals from metrics that only add noise.
KPI Design & Monitoring
Many companies collect huge amounts of data, but without clear indicators it is difficult to understand what is really working. I design tailored KPIs that turn business goals and data into more informed decisions.
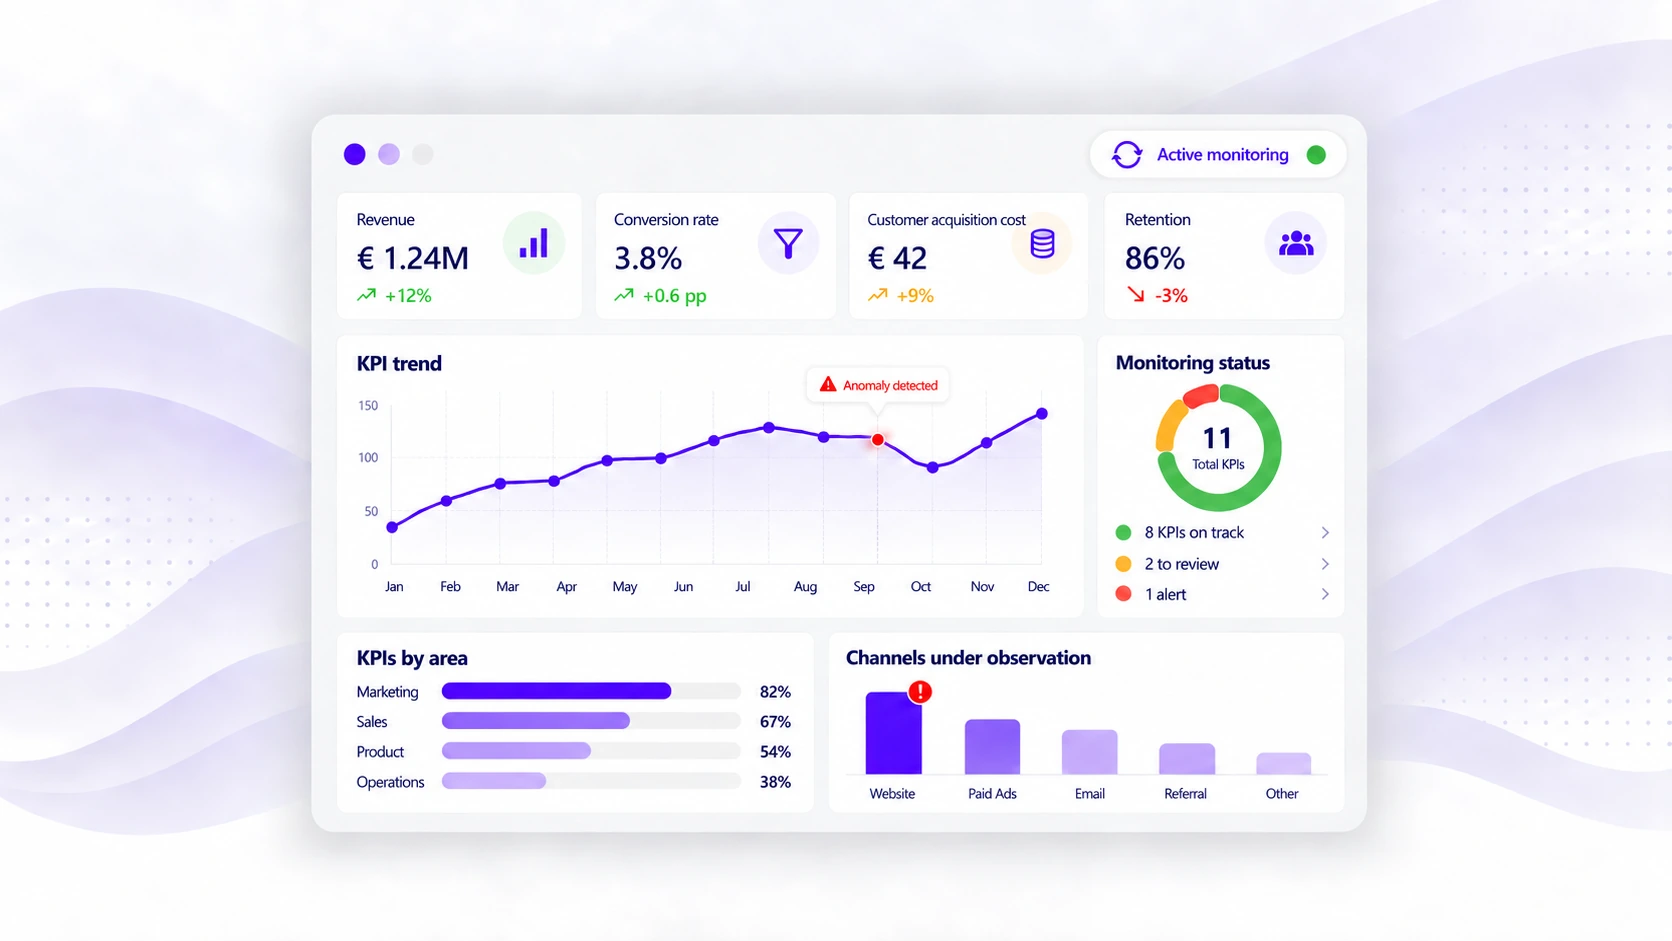
Example of an executive KPI monitoring dashboard
The problem isn't the data
Companies collect many metrics, but they often lack shared definitions, clear priorities, and a direct link between indicators and business objectives. The result is a measurement system that is difficult to interpret and use.
When everything is measured, it becomes difficult to distinguish meaningful signals from metrics that only add noise.
Formula, scope, frequency, and data source are not documented, so the same KPI may be interpreted differently.
Goals remain too generic and are not translated into targets, deadlines, and measurable success criteria.
Without shared reference points, priorities and evaluations rely more on perceptions than on comparable evidence.
A good KPI doesn't add complexity: it makes what truly matters immediately visible.
A common language for business
Every indicator is designed to answer a specific business question, measure a concrete objective, and make results, deviations, and priorities easy to interpret.
Every KPI is linked to an expected outcome, a responsible owner, and a concrete business decision.
Formula, data source, frequency, scope, and meaning are documented to eliminate inconsistent interpretations.
KPIs are organised aaround monitoring frequencies that match what needs to be measured and the pace of decision-making.
Historical data, targets, benchmarks, and variations help interpret each metric in the right context.
Alert levels and intervention criteria make deviations and unusual situations immediately visible.
A shared measurement system reduces discussions about numbers and keeps the focus on actions.
What We Can Define Together
There is no universal set of KPIs. Indicators are defined according to your objectives, processes, responsibilities, and the actual availability of data.
Area 01
Monitor sales performance, profitability, and commercial activities to identify opportunities, risks, and priorities.
Area 02
Assess financial performance by connecting costs, profitability, cash flow, and business results.
Area 03
Monitor efficiency, operational capacity, and process quality across the most critical business activities.
Area 04
Evaluate the effectiveness of acquisition activities and the real contribution of campaigns to business results.
Area 05
Bring together the most important indicators to support strategic control, alignment, and faster decision-making.
Area 06
Every KPI is designed according to your industry, your priorities, and the questions you need answered.
What's Included
The project includes everything needed to make the solution understandable, reliable, and practical for everyday business use.
Translating strategic and operational priorities into measurable business outcomes.
Selection of the indicators needed to evaluate objectives and performance.
Shared definitions of formulas, data sources, frequencies, and scopes.
Creation of KPI sheets or a searchable data dictionary.
Organization of indicators into a monitoring system aligned with roles, decision-making frequency, and business responsibilities.
Definition of expected levels and alert criteria.
Definition of criteria aand review cycles to assess KPI relevance over time and update the framework when needed.
Sharing KPI definitions and supporting their adoption.
Why It's Tailored
Two companies may collect similar data while having completely different objectives, responsibilities, and priorities. That's why every KPI framework is built around real business processes, the decisions it needs to support, and the people who will use it.
The result is not simply having more numbers: it's having better criteria for making decisions.
Every KPI is associated with a precise definition, formula, data source, frequency, and owner.
Teams and managers use the same definitions, reducing inconsistent interpretations and discussions about the origin of the numbers.
KPIs, targets, and thresholds can be reviewed as strategies, processes, or priorities change, while maintaining consistency with the existing framework.
The Right Solution
A KPI framework creates value when it aligns objectives, responsibilities, and evaluation criteria through genuinely shared indicators.
Not sure whether this is the right service? During our first consultation we'll assess your objectives, current KPIs, and existing challenges to determine whether your KPI framework needs to be designed, reviewed, or standardized.
Frequently Asked Questions
Answers to the most common questions about selecting, defining, reviewing, and monitoring business KPIs.
There is no one-size-fits-all answer. It's better to focus on a limited number of KPIs that are directly linked to business objectives and stakeholder responsibilities. During the analysis, we'll distinguish between strategic, operational, and supporting metrics.
Yes. An effective KPI framework evolves with the business. New objectives, processes, or data sources may require new indicators without compromising the existing measurement framework.
Absolutely. A manufacturing company, a service business, and an e-commerce company have completely different objectives. That's why every project starts with process analysis and the definition of KPIs that truly support decision-making.
Yes. Existing Excel reports, management systems, and dashboards are often an excellent starting point. We'll analyze what you already use and identify which indicators to keep, improve, or replace.
Yes. The framework is designed to evolve with your business. New indicators, departments, responsibilities, or objectives can be integrated while maintaining consistent definitions, formulas, and monitoring criteria.
No. The KPI design methodology is independent of the tool used. Power BI is the platform I use most often, but the framework can be adapted to other Business Intelligence solutions whenever needed.
I don't start from the list of available metrics, but from the decisions that need to be made. Every KPI is selected because it helps evaluate an objective, identify a problem, or measure a meaningful business outcome.
Want to see some completed projects? View selected projects →
Let's Start with Your Goals
If different teams are using different indicators today, we can build a shared KPI framework that connects objectives, formulas, targets, and responsibilities.
Together we'll review your current situation, available data sources, and the objectives you want to monitor to determine the most suitable solution.