Revenue 2020
51,88Mln
+52% vs 2019
Revenue shows significant growth compared to the previous year, confirming a positive sales performance trend.
BUSINESS CASE STUDY
Personal Power BI case study developed to simulate a sales performance analysis workflow. The project combines revenue, profit, conversion rate, geographic distribution, targets, forecasting and sales pipeline data in a single view designed to support performance monitoring and the identification of commercial priorities.
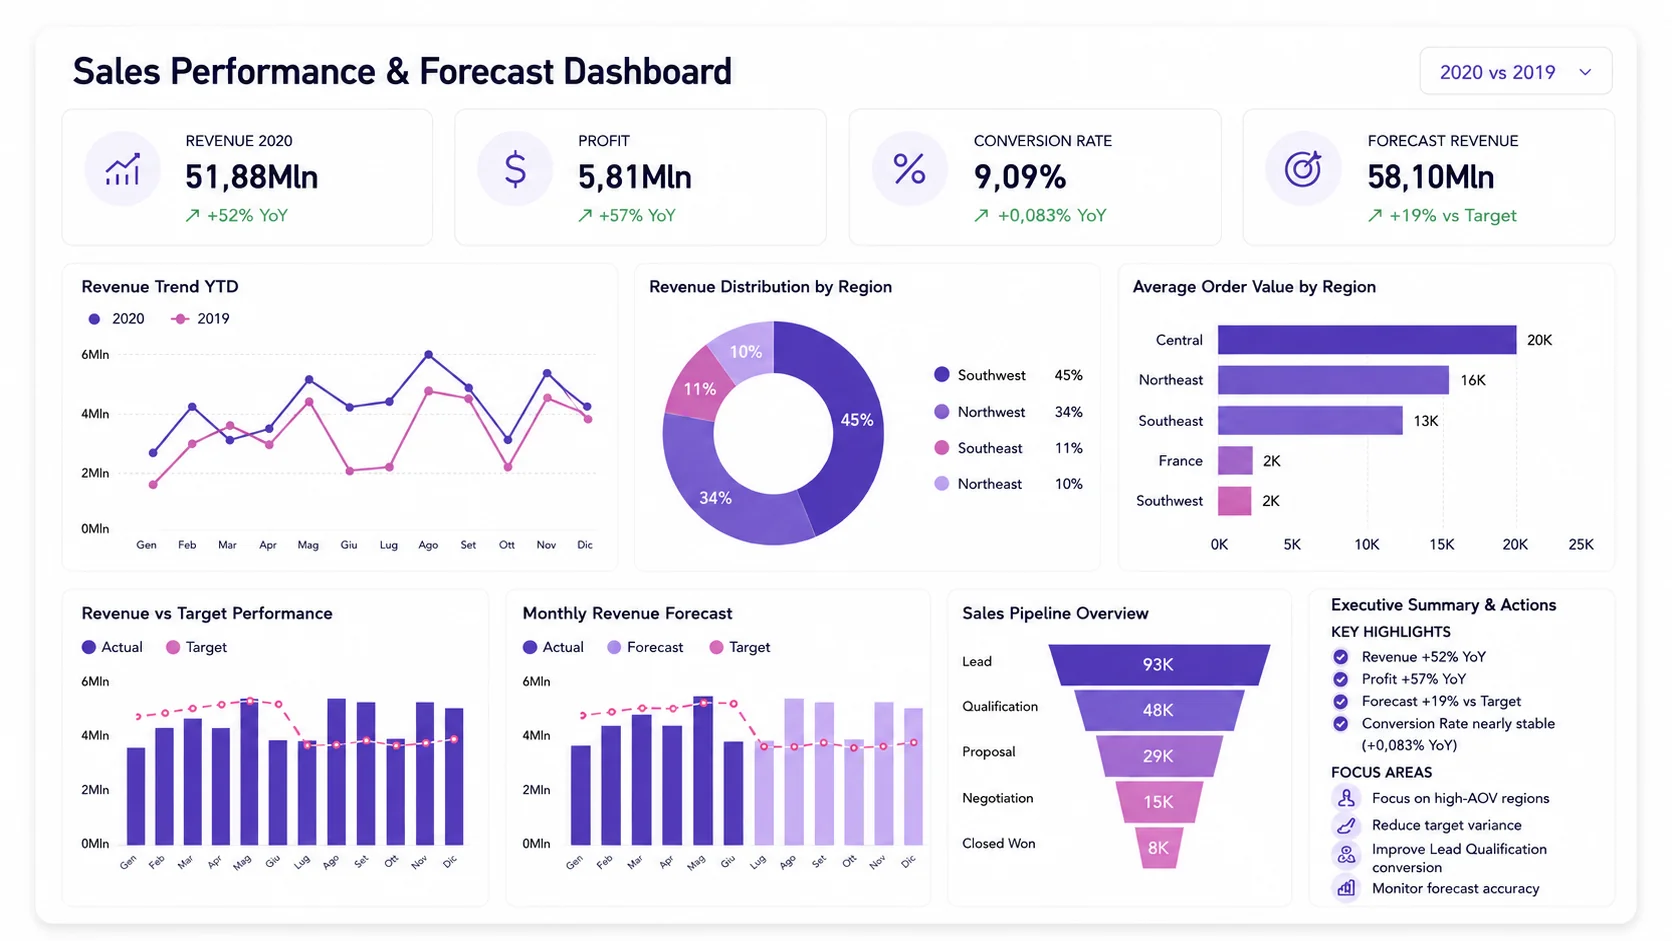
Executive Snapshot
A summary of the main findings from the analyzed dataset: revenue and profit growth, a broadly stable conversion rate and forecast revenue above target.
Revenue 2020
+52% vs 2019
Revenue shows significant growth compared to the previous year, confirming a positive sales performance trend.
Profit 2020
+57% vs 2019
Profitability grows faster than revenue, highlighting an improvement in the economic quality of sales.
Conversion Rate
+0,083% YoY
The conversion rate remains almost stable, highlighting an area to monitor in order to improve sales efficiency.
Forecast Revenue
+19% vs Target
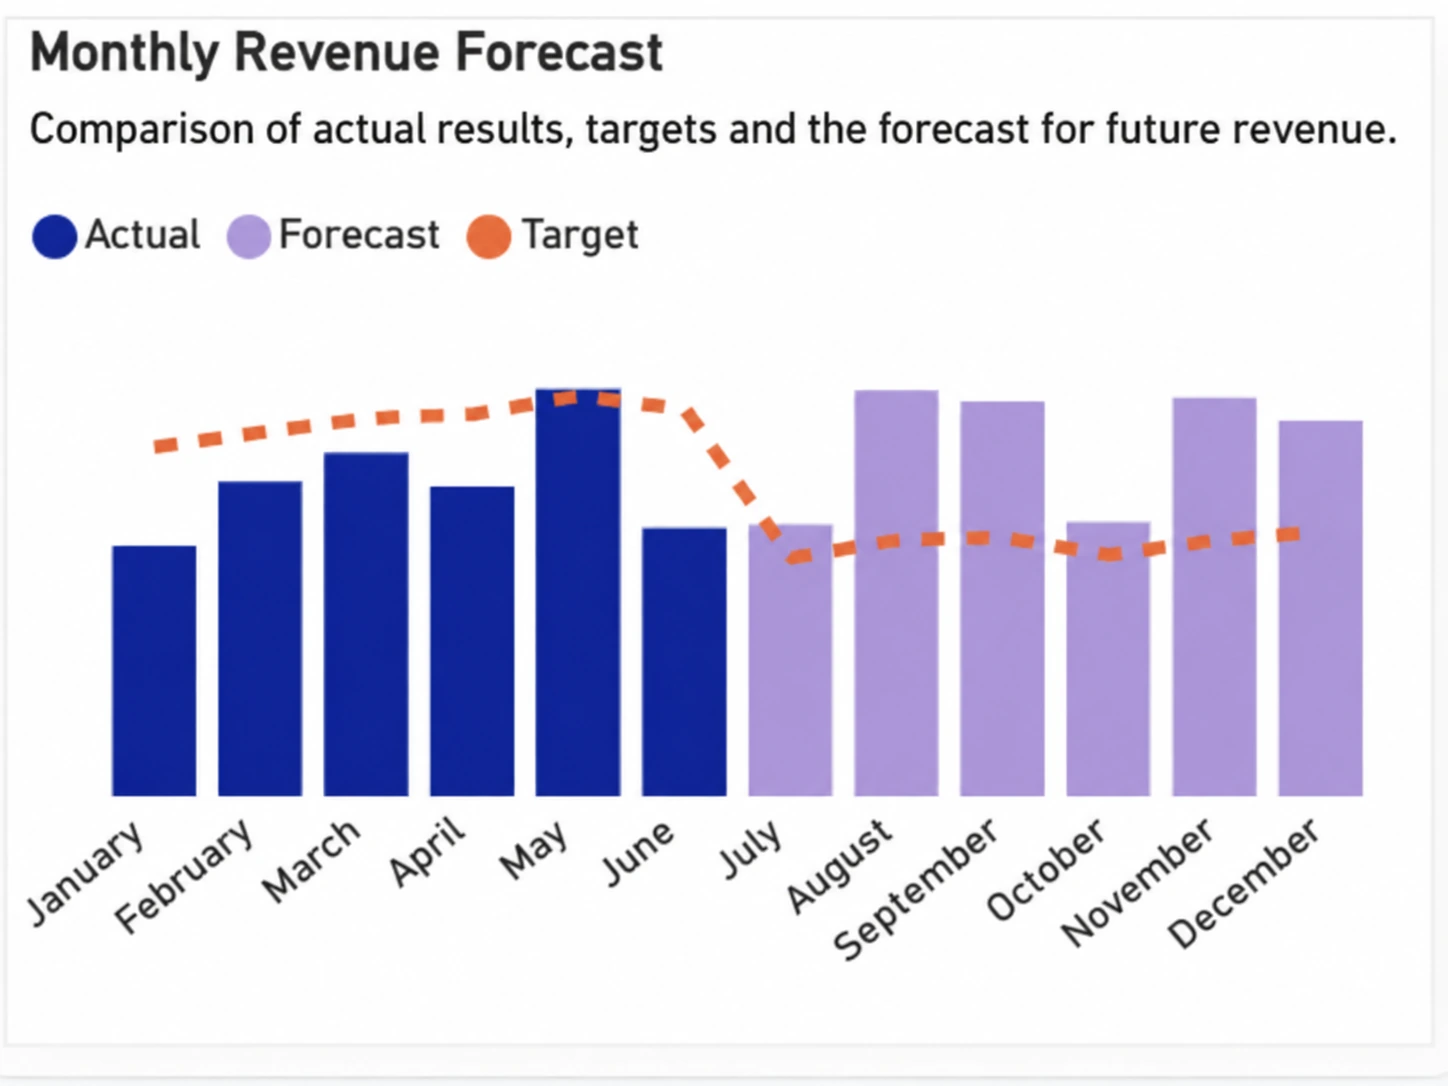
The revenue forecast exceeds the target, providing a useful basis to evaluate future performance and sales priorities.
Southwest
revenue share
Geographic distribution highlights a dominant region in the revenue mix and supports targeted investment decisions.
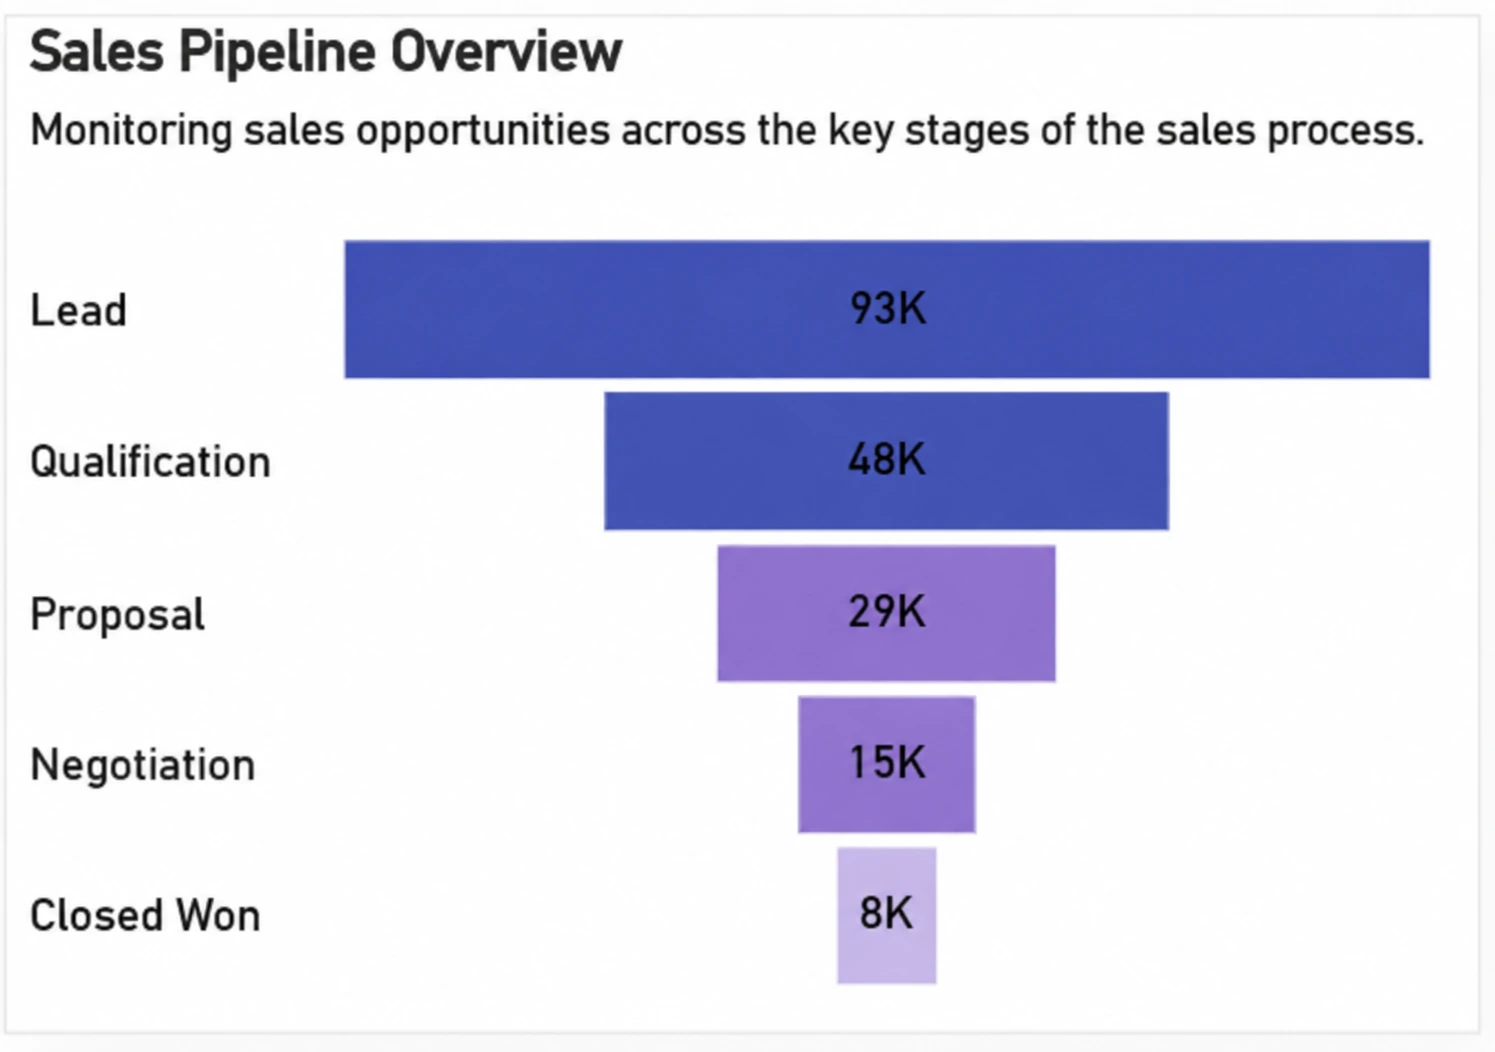
Pipeline
Lead stage
The sales funnel shows volumes across the different stages of the sales process, from lead generation to closing.
Dashboard Preview
The dashboard combines sales KPIs, revenue trends, geographic distribution, forecast, performance versus target, and sales pipeline into one decision-oriented view.
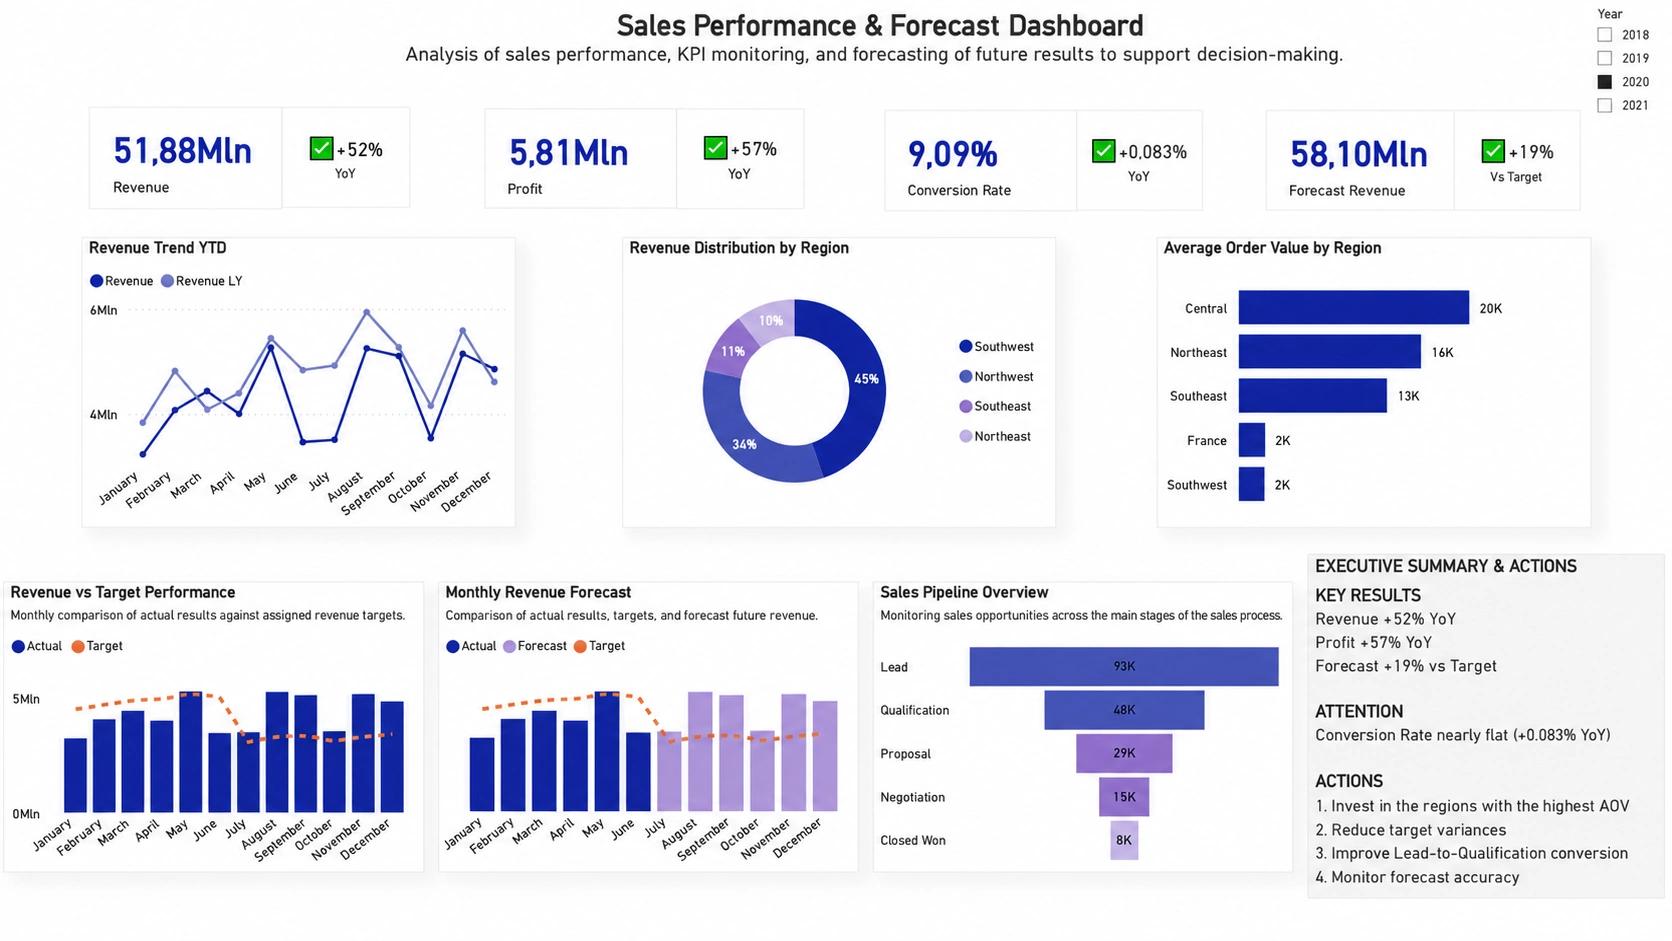
Click the dashboard to view it in full screen.
Context
Sales performance does not depend on a single indicator: to correctly interpret business trends, it is necessary to connect revenue, profit, conversion, geographic distribution, targets, and future forecasts into one analytical view.
Business Challenge
The sales analysis required a clear reading of results, variances against targets, and improvement opportunities across the sales funnel.
The need to compare actual results with revenue targets in order to identify variances and areas requiring attention.
Lack of an immediate view of future revenue forecasts and their alignment with business targets.
The need to monitor sales opportunities across the sales process to understand conversion and drop-off between stages.
Analytical Approach
The project was developed through a structured analytical process: from defining sales KPIs to reading variances, forecasting results, and generating operational recommendations.
Identification of the key metrics needed to monitor revenue, profit, conversion, and sales performance.
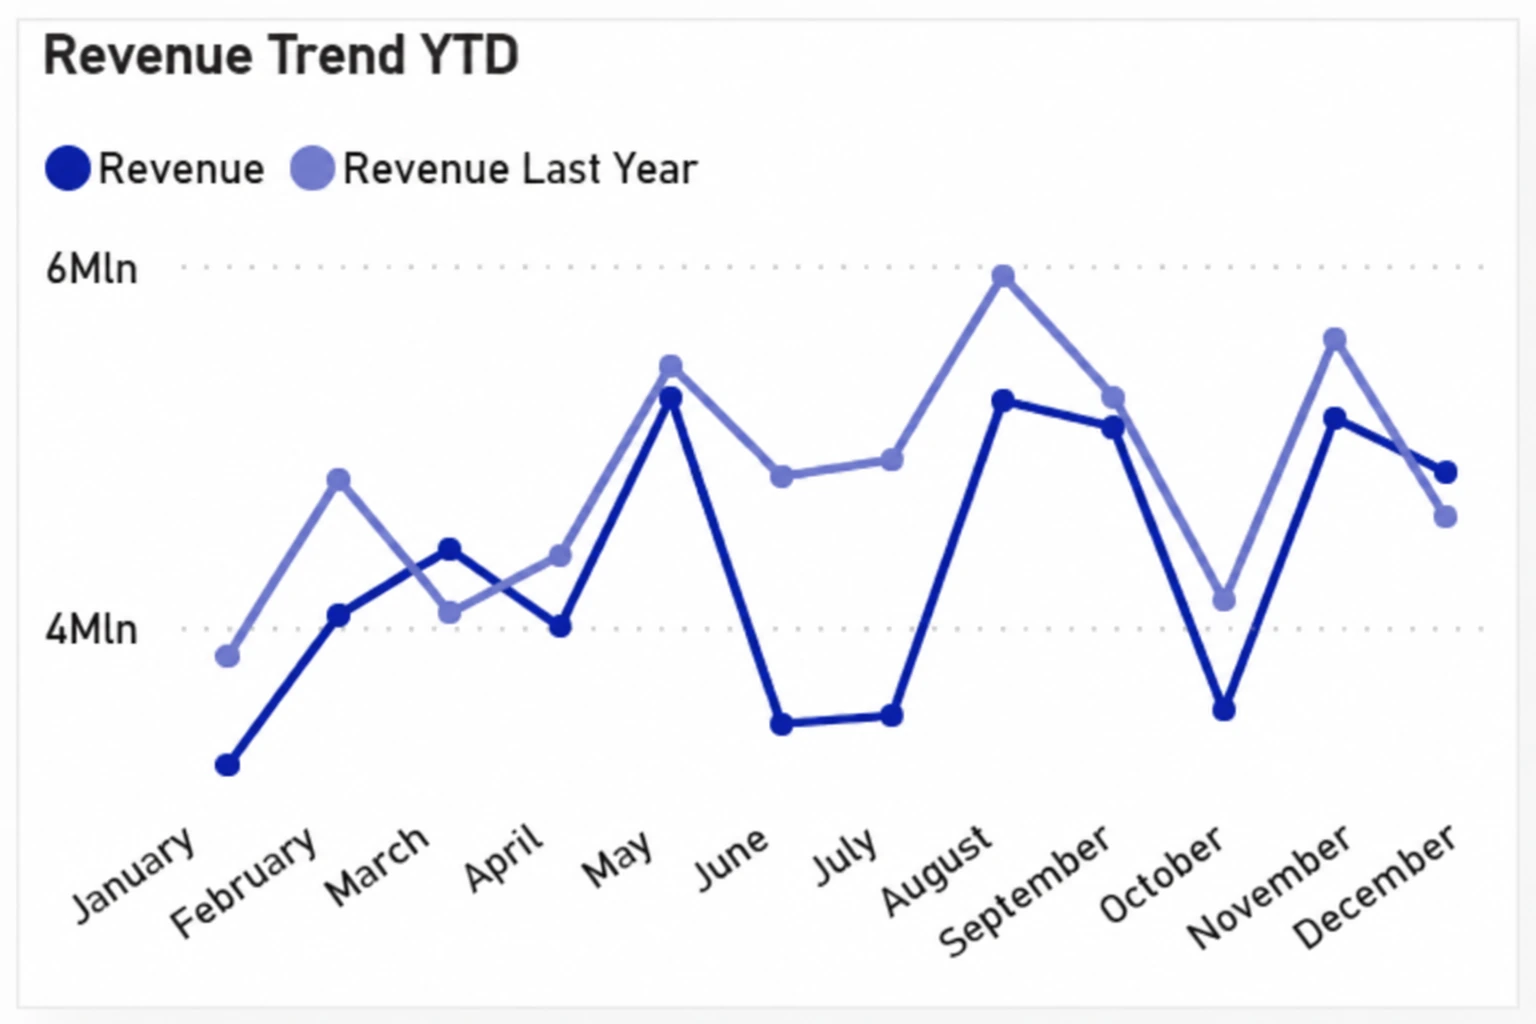
Year-over-year comparison and monthly revenue analysis to identify patterns, peaks, and performance declines.
Integrated reading of actual results, assigned targets, and forecast to evaluate distance from objectives.
Sales funnel analysis to understand critical stages and support decisions on conversion and sales priorities.
Solution Developed
The dashboard was designed to support sales decision-making through an integrated framework of KPIs, revenue analysis, forecast, and pipeline. The goal is to provide a clear reading of current and future performance, making it easier to monitor targets and identify business priorities.
KPI Framework
Dashboard indicators were organized into three analytical areas to connect economic performance, forecasting, and the sales process.
Area 01
Measures sales economic performance and the business’s ability to generate revenue and profit.
Revenue • Profit • Conversion • YoY
Area 02
Analyzes the relationship between actual results, assigned targets, and future revenue forecasts.
Actual • Forecast • Target • Variance
Area 03
Highlights geographic revenue distribution and opportunity behavior across the sales funnel.
Region Mix • AOV • Pipeline • Lead
Case study insights
The case study brings together YoY performance, profitability, conversion, forecasting, targets and sales pipeline data in an integrated view, making the main findings in the dataset and the areas requiring attention easier to identify.
0
2020 revenue change vs 2019
0
2020 profit change vs 2019
0
Forecast vs Target
0
Conversion Rate
I design Power BI dashboards and data storytelling solutions that make KPIs, trends, forecasts, and insights immediately usable for business decisions.
Free Consultation
Fill in the form and briefly describe your needs. I will get back to you to understand how to make your KPIs, reports, and dashboards clearer.