Fragmented information
Data is spread across separate files, systems and reports, making it difficult to build a reliable overview.
Custom Power BI Dashboards
A dashboard designed around your goals, your data sources and the decisions you need to make every day.
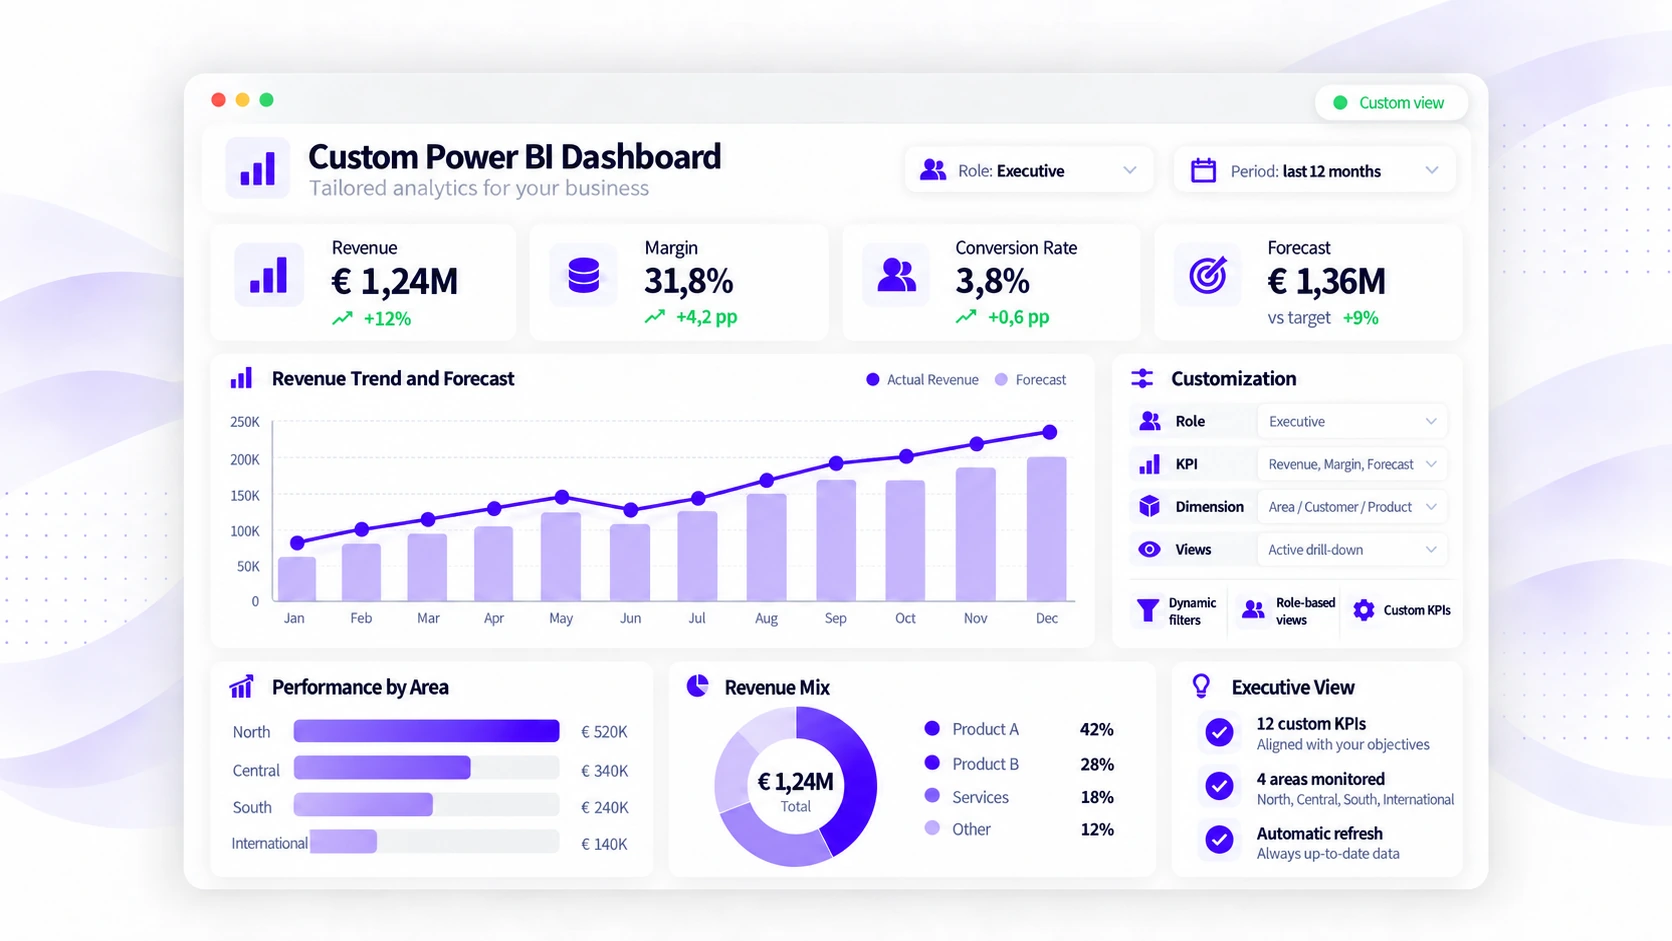
Example of an executive Power BI dashboard
The problem is not the data
Excel files, ERP systems, CRMs and other tools generate data every day. The real challenge is turning it into one clear, timely and decision-ready view.
Data is spread across separate files, systems and reports, making it difficult to build a reliable overview.
Metrics are numerous, poorly prioritised or interpreted differently across business departments.
Information arrives when the issue is already visible and the time available to act has narrowed.
Too many hours are spent finding, comparing and rebuilding figures instead of understanding and using them.
An effective dashboard does not add more data: it organises the right data in the most useful way for decision-making.
A decision-making tool
Every page is designed to answer the most important questions in your business and make signals, variances and priorities immediately visible.
Track only the metrics that genuinely help assess performance, results and areas requiring action.
Hierarchy, colour and visualisation guide attention towards what truly requires a decision.
Filters, drill-downs and comparisons let you explore data, periods, departments and categories without creating new reports.
A structure designed to maintain smooth navigation, efficient updaates, and reliable performance over time.
Every visual element has a clear purpose: to improve understanding, not simply fill space.
New sources, metrics, departments and requirements can be added without rebuilding everything from scratch.
What you can monitor
There is no one-size-fits-all dashboard. Its structure is defined around your industry, processes, responsibilities and the decisions you need to make.
Area 01
Monitor sales, margins and commercial performance to identify opportunities, risks and priorities.
Area 02
Understand financial performance by connecting costs, profitability, cash flow and results.
Area 03
Monitor efficiency, operational capacity and process quality across your most important activities.
Area 04
Assess acquisition performance and the real contribution of campaigns to business results.
Area 05
Bring the most important indicators together in an executive view designed for control, alignment and faster decisions.
Area 06
Every metric is defined around your industry, priorities and the questions your business needs to answer.
What the service includes
The project includes everything required to make the solution clear, reliable and genuinely usable in day-to-day business operations.
Structure, pages and visualisations designed around your information needs.
Metrics selected, contextualised and linked to the goals you need to monitor.
Integration of compatible sources required to build and refresh the dashboard.
Relationships and logic structured to ensure consistency, accuracy and performance.
Simple analysis paths that move from the overall view to detailed insights.
A streamlined, controlled structure designed for a smooth and stable experience.
A dedicated session to understand the dashboard and use it independently.
Post-delivery support for questions, checks and initial operational needs.
Why custom-built
Two companies may collect similar data yet have completely different decision-making needs. That is why the dashboard is built around your processes, responsibilities and the way you use information.
The result is not simply a better-looking dashboard: it is a more useful dashboard.
I do not force your business into a standard model. I organise the solution around what you need to monitor and improve.
Every view answers a specific question and highlights the information needed to act.
New sources, metrics and requirements can be added over time without starting again from scratch.
The right solution
A custom dashboard creates value when there is a genuine need for control, clarity and consistent decision-making.
Not sure whether this is the right solution? During the initial consultation, we will assess your situation and determine whether a dashboard is genuinely the right tool for your goal.
Frequently asked questions
Answers to the most common questions about designing and using a custom Power BI dashboard.
Yes. Excel files can be used as a starting source, provided their structure, quality and refresh process are suitable for the required outcome. Any issues will be reviewed during the initial assessment.
It depends on the system, the available access methods and the licence in use. Direct connections, databases, structured exports and other compatible integrations can be assessed.
Timing depends on the number of sources, data quality, KPI complexity and dashboard scope. After an initial assessment, you will receive a realistic project estimate.
The goal is to make day-to-day use as independent as possible. Refresh methods and frequency depend on the data sources and the agreed project architecture.
Not necessarily at the initial stage. The required licences depend on how the dashboard will be published, shared and viewed. The most appropriate setup will be assessed according to the number of users and intended usage.
Yes. The solution can be designed to progressively include new sources, metrics, pages and users while maintaining a consistent and manageable structure.
Would you like to see the standard of dashboards already delivered? View selected projects →
Let us start with your data
If your data is currently spread across Excel files, reports and different systems, we can turn it into a dashboard designed to help you monitor the business and make decisions with greater confidence.
Together, we will assess your current situation, available data sources and monitoring goals to identify the most suitable solution.