Revenue 2024
€4.03M
-12% YoY
Revenue contracted compared to 2023, requiring a deeper analysis of the drivers behind the decline.
🥇 Winning Project
Power BI dashboard created for the 2024 “In viaggio coi dati” contest, organized by BLASTNESS in collaboration with DATI365, where it ranked 1st place. The project analyzes hotel performance through revenue, occupancy, ADR, RevPAR and booking channels, turning the patterns identified in the data into insights and recommendations for revenue management.
Executive Snapshot
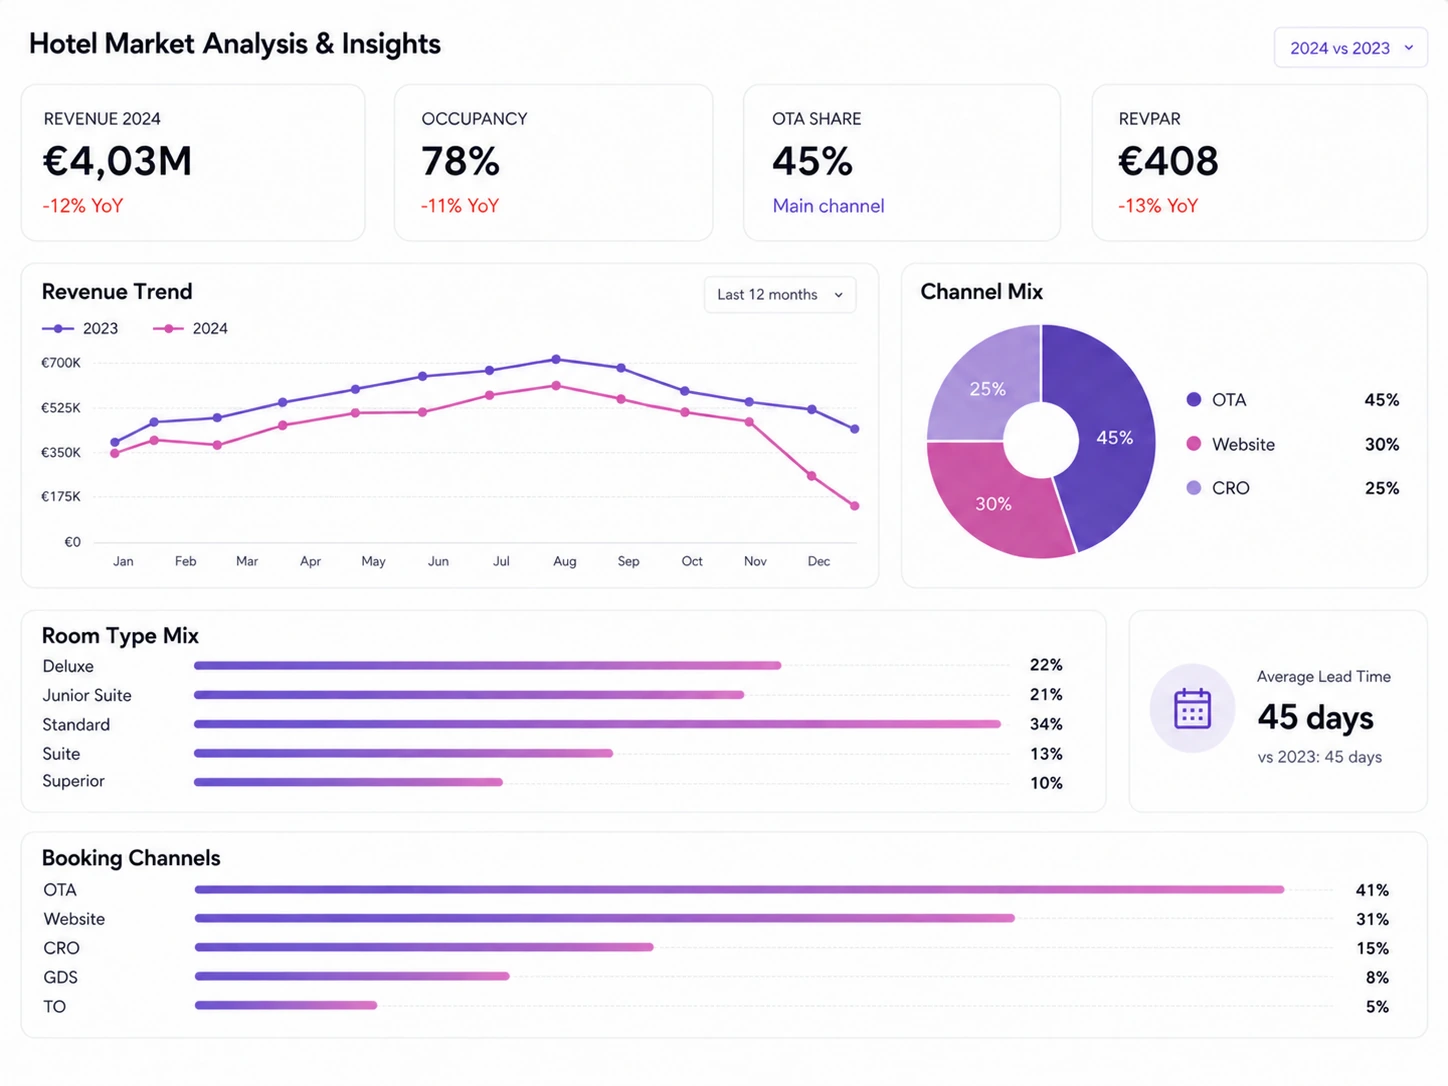
A concise overview of the main findings from the 2023–2024 comparison: revenue decline, lower occupancy, OTA dependency and reduced profitability per available room.
Revenue 2024
-12% YoY
Revenue contracted compared to 2023, requiring a deeper analysis of the drivers behind the decline.
Occupancy Rate
-11% YoY
Occupancy decreased, with the strongest deterioration occurring in the final part of the year.
OTA Share
Main channel
OTA channels dominate the booking mix, highlighting a strong dependency on intermediated distribution channels.
RevPAR 2024
-13% YoY
Revenue per available room decreased, making profitability monitoring a key revenue management priority.
Lead Time Avg
Booking behavior
Lead time analysis helped interpret demand patterns and the impact of last-minute bookings.
Contest Result
Winning project
The dashboard was awarded for data storytelling, KPI clarity and decision-support effectiveness.
Dashboard Preview
The dashboard combines revenue analysis, occupancy trends, booking channels and profitability metrics into one decision-oriented view.
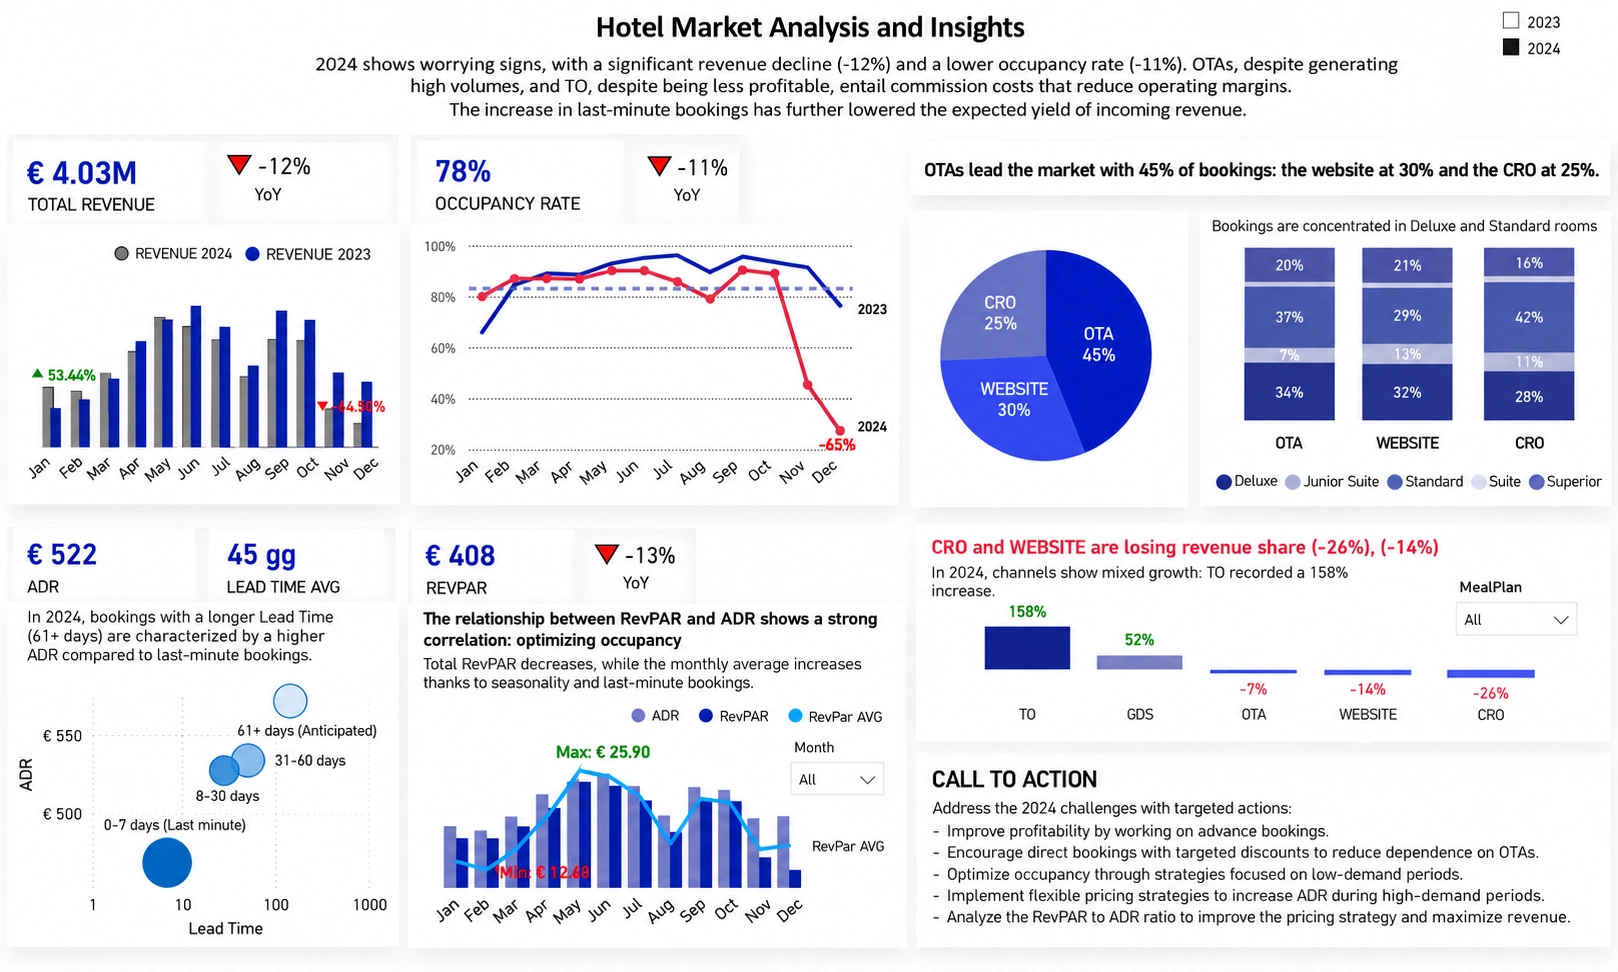
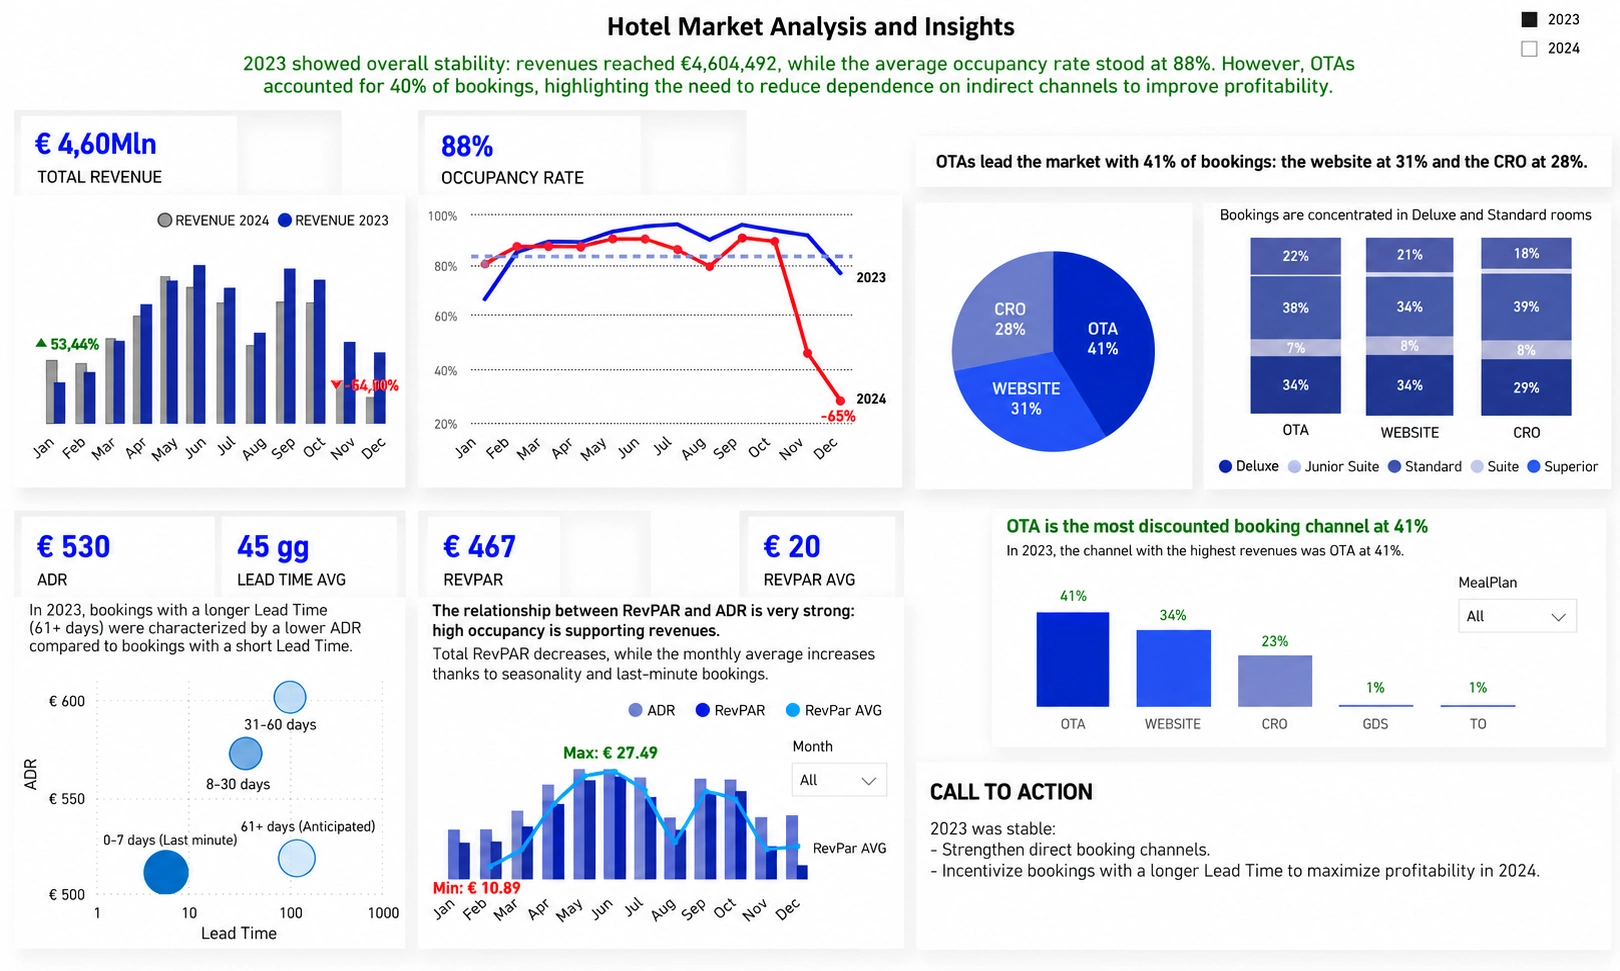
Click the dashboard to view it in full screen.
Context
Hospitality is shaped by seasonality, dynamic pricing and increasingly fragmented booking channels. To properly evaluate hotel performance, looking at revenue alone is not enough: occupancy, ADR, RevPAR, lead time and channel distribution must be connected into a single analytical view.
Business Challenge
The 2024 analysis highlights three critical areas: declining revenue, dependency on intermediated channels and pressure on profitability.
Year-over-year revenue decline required a clear understanding of the root causes behind the contraction.
The strong weight of intermediated channels may affect margins and reduce commercial control.
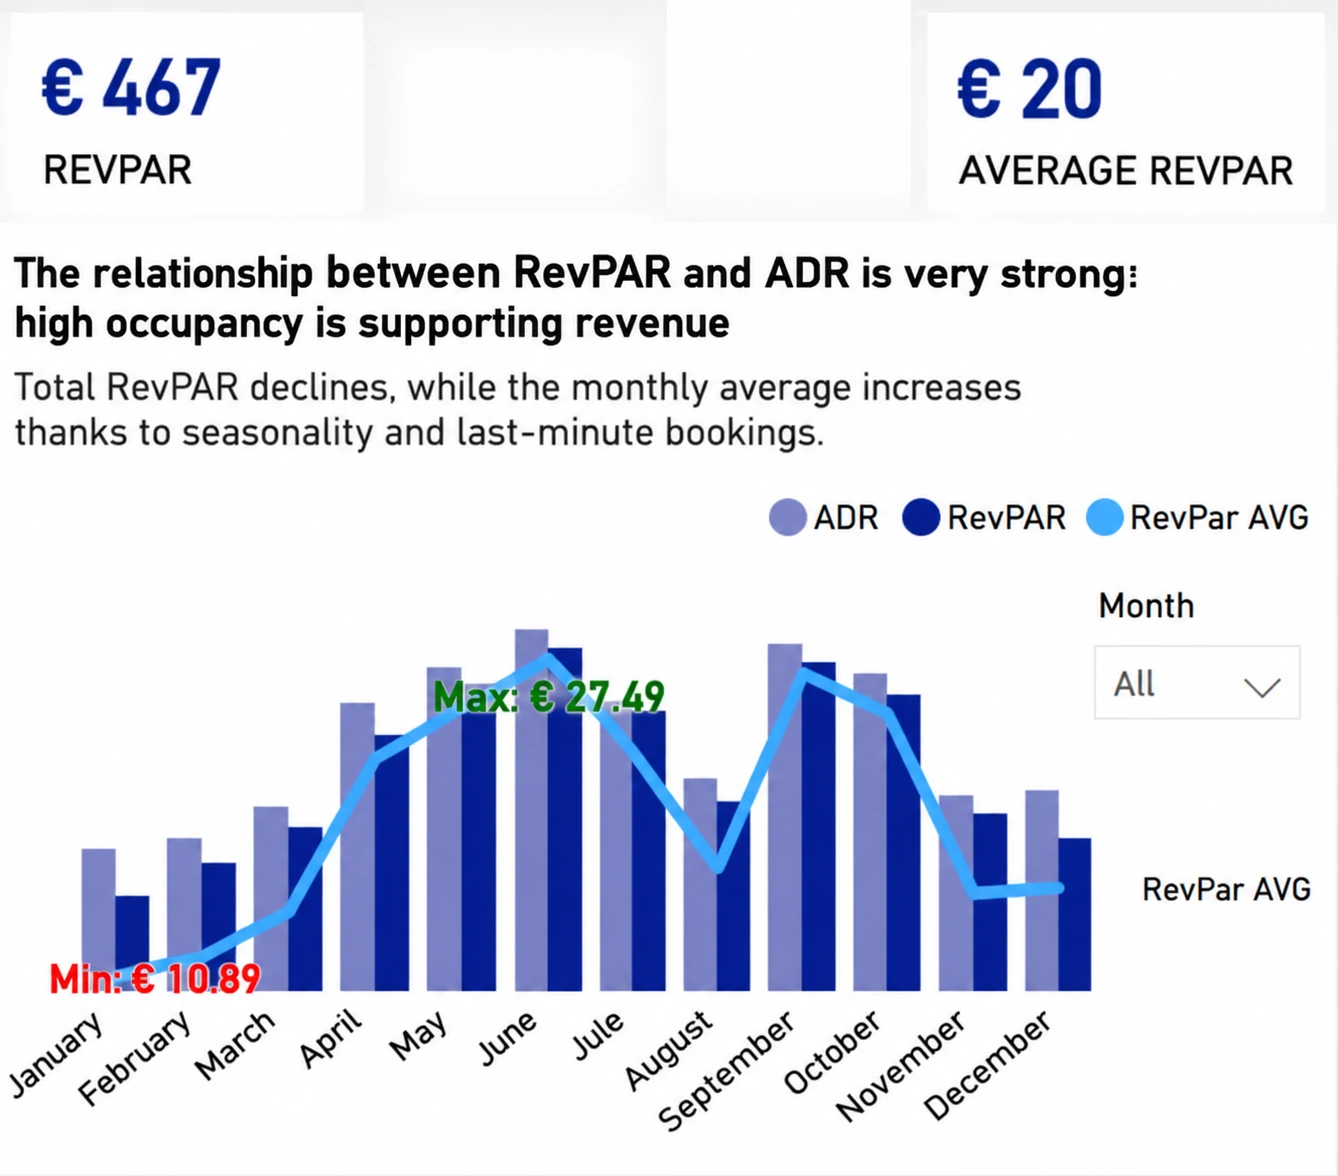
RevPAR decline required integrated monitoring of ADR, occupancy and profitability dynamics.
Analytical Approach
The project was developed through a structured analytical process: from defining hospitality KPIs to reading performance gaps and generating operational recommendations.
Selection of core metrics to measure performance, profitability and demand behavior.
Comparison between 2023 and 2024 to identify trends, gaps and critical performance signals.
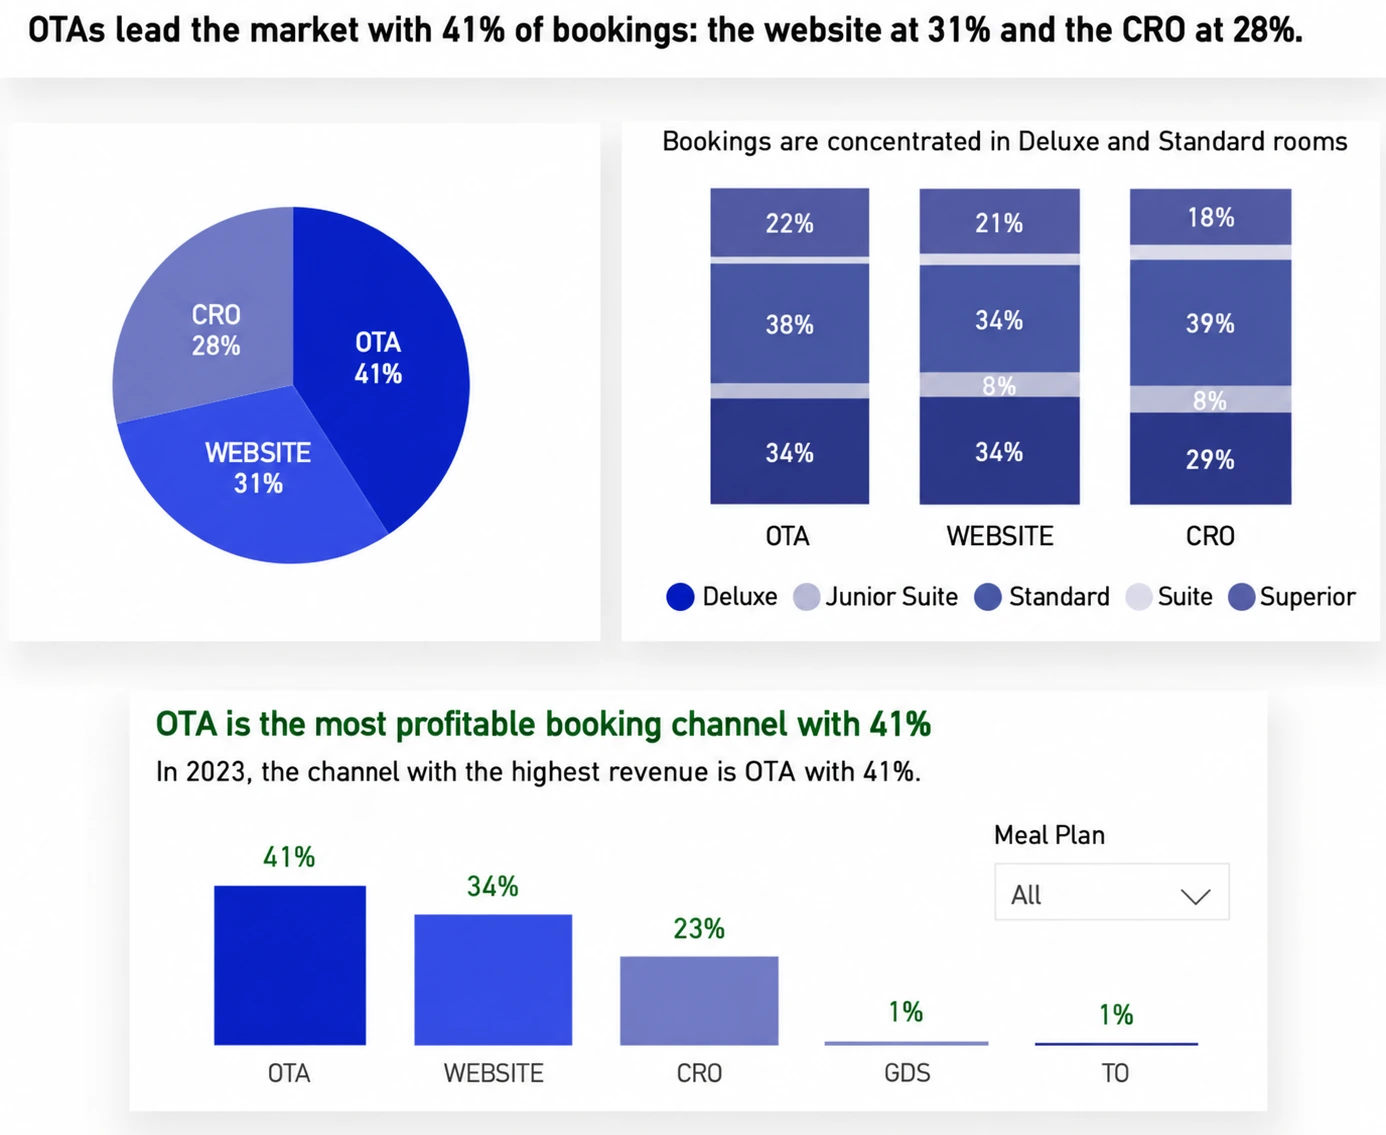
Analysis of the booking mix to evaluate the weight of intermediated channels and the contribution of direct channels.
Translation of the analysis into actionable insights for pricing, distribution and revenue management decisions.
Solution Developed
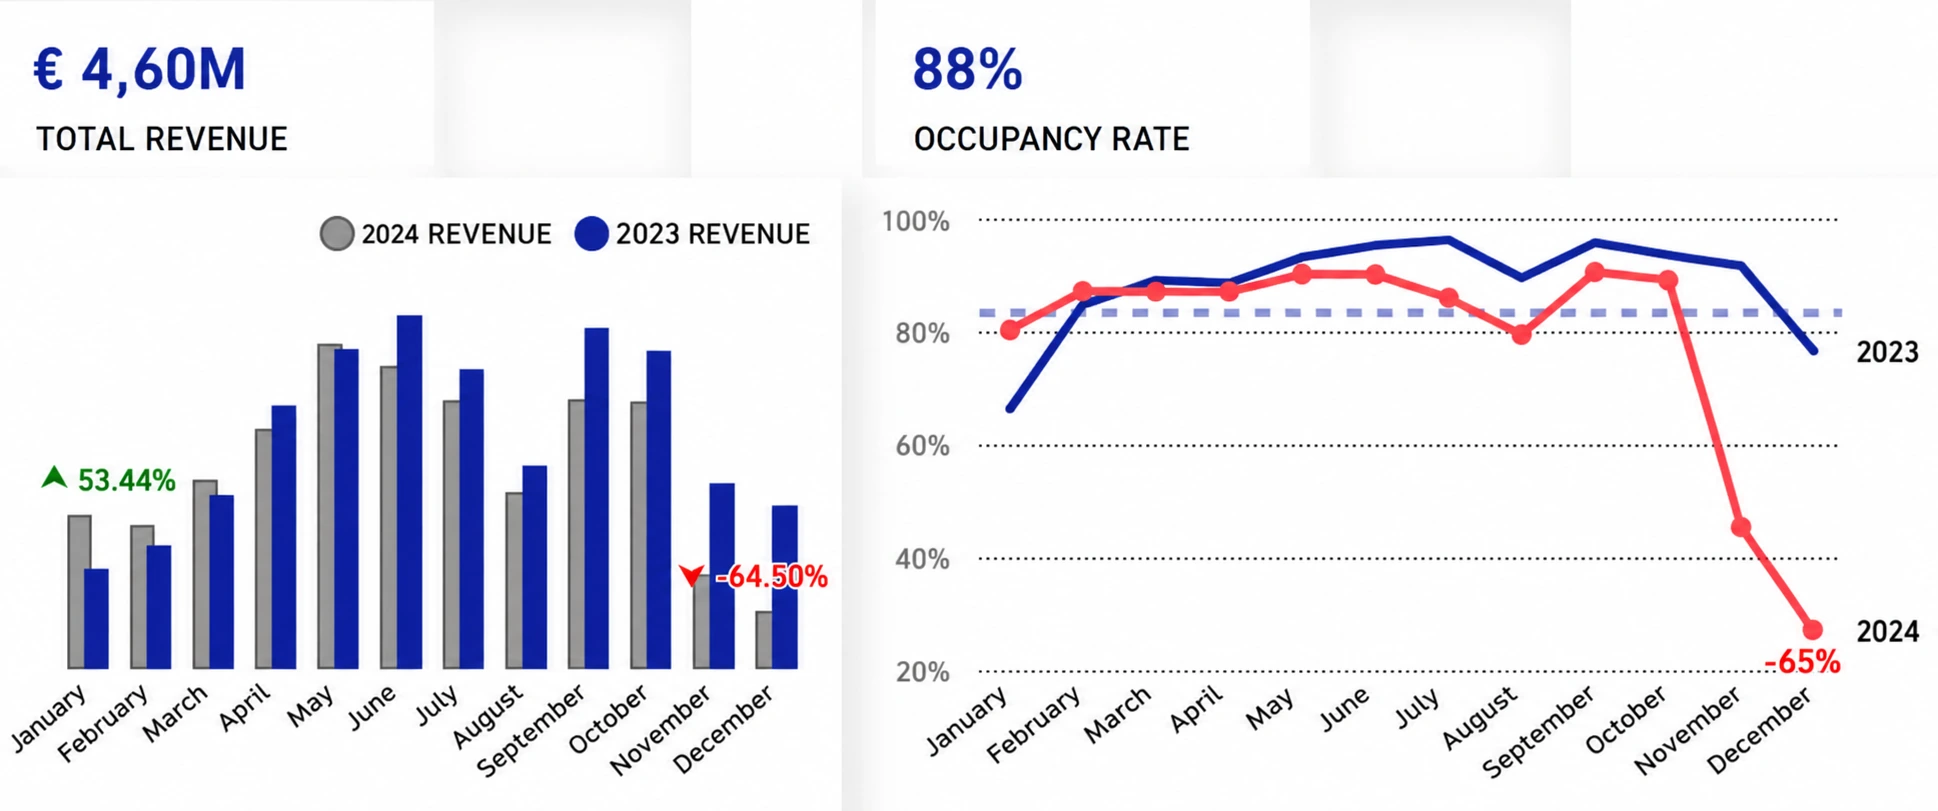
The dashboard was developed to support decision-making in the hospitality sector by combining performance indicators, booking channel analysis and demand dynamics into one strategic view.
KPI Framework
Dashboard indicators were organized into three analytical areas: economic performance, booking behavior and channel distribution.
Area 01
Measures the hotel’s economic performance and its ability to generate revenue against available occupancy.
Revenue • Occupancy • ADR • RevPAR
Area 02
Analyzes demand behavior, booking lead time and the mix of room categories sold.
Lead Time • Booking Window • Room Mix • Demand
Area 03
Highlights the weight of booking channels in the revenue mix and helps evaluate OTA dependency, direct performance and commercial control.
Channel Mix • OTA • Website • CRO
INSIGHT & RECOGNITION
The comparison between 2023 and 2024 made the decline in revenue, changes in occupancy and the weight of booking channels easier to interpret. The dashboard brought these signals together in a decision-oriented view and achieved 1st place in the 2024 “In viaggio coi dati” contest.
0
OTA share in 2024
0
KPIs integrated into the dashboard
0
2024 revenue change vs 2023
0
"In viaggio coi dati" 2024 contest
I design Power BI dashboards and data storytelling solutions that make KPIs, trends and insights immediately usable for business decisions.
Free Consultation
Fill in the form and briefly describe your needs. I will get back to you to understand how to make your KPIs, reports and dashboards clearer.