2026 Revenue
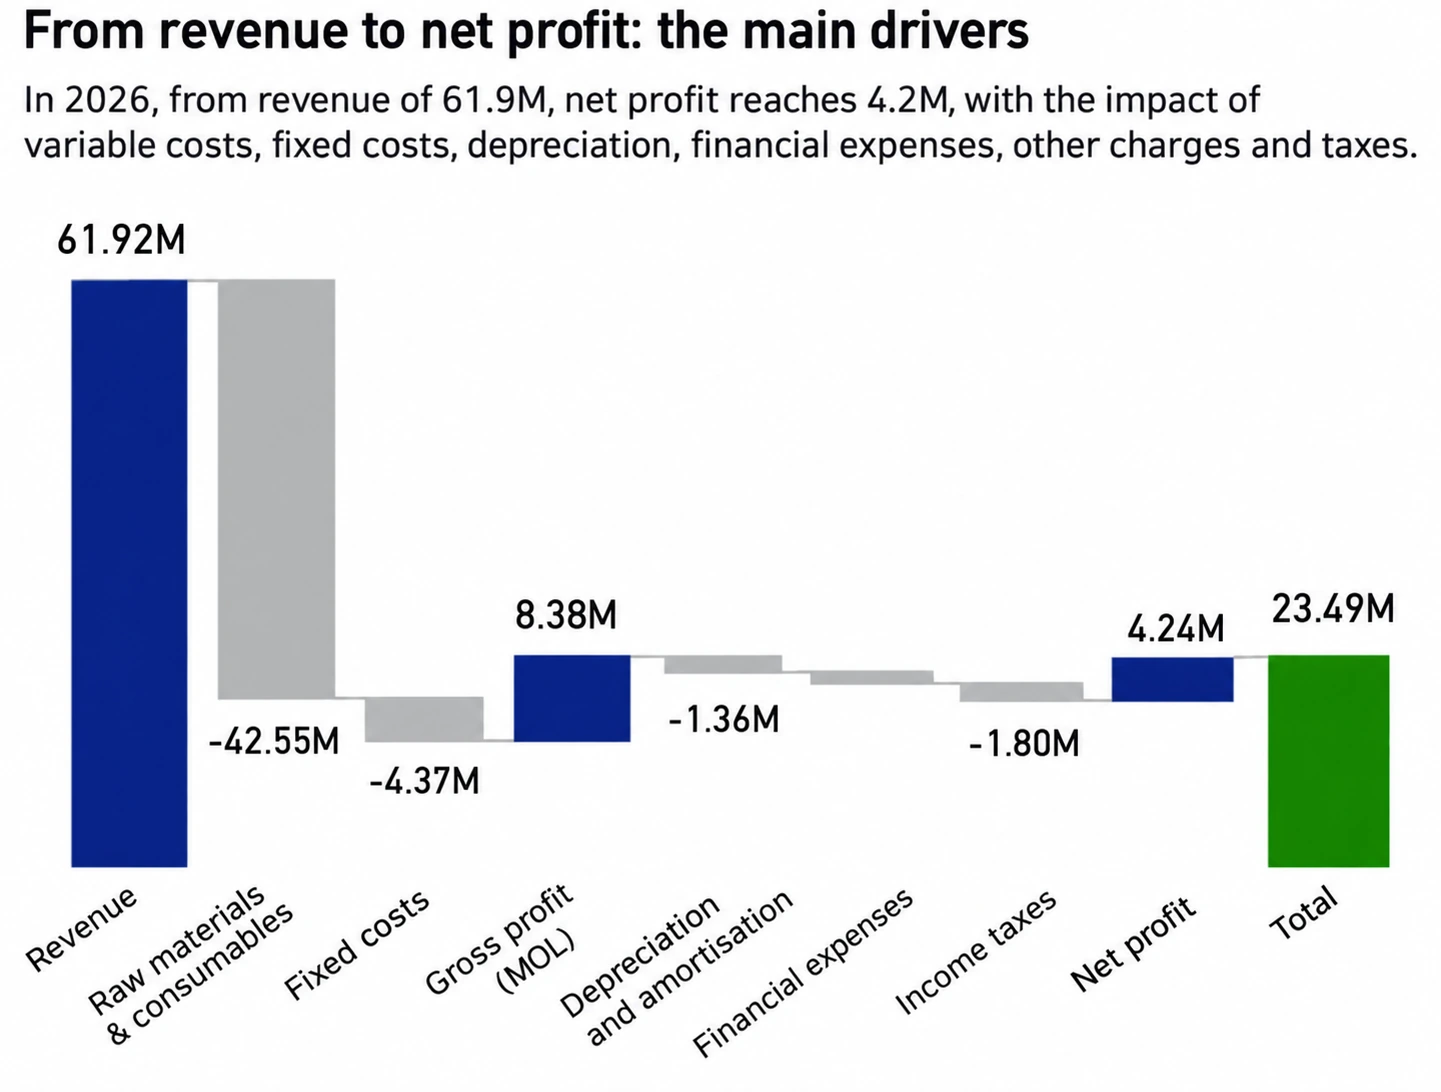
61,92Mln
+9,17%
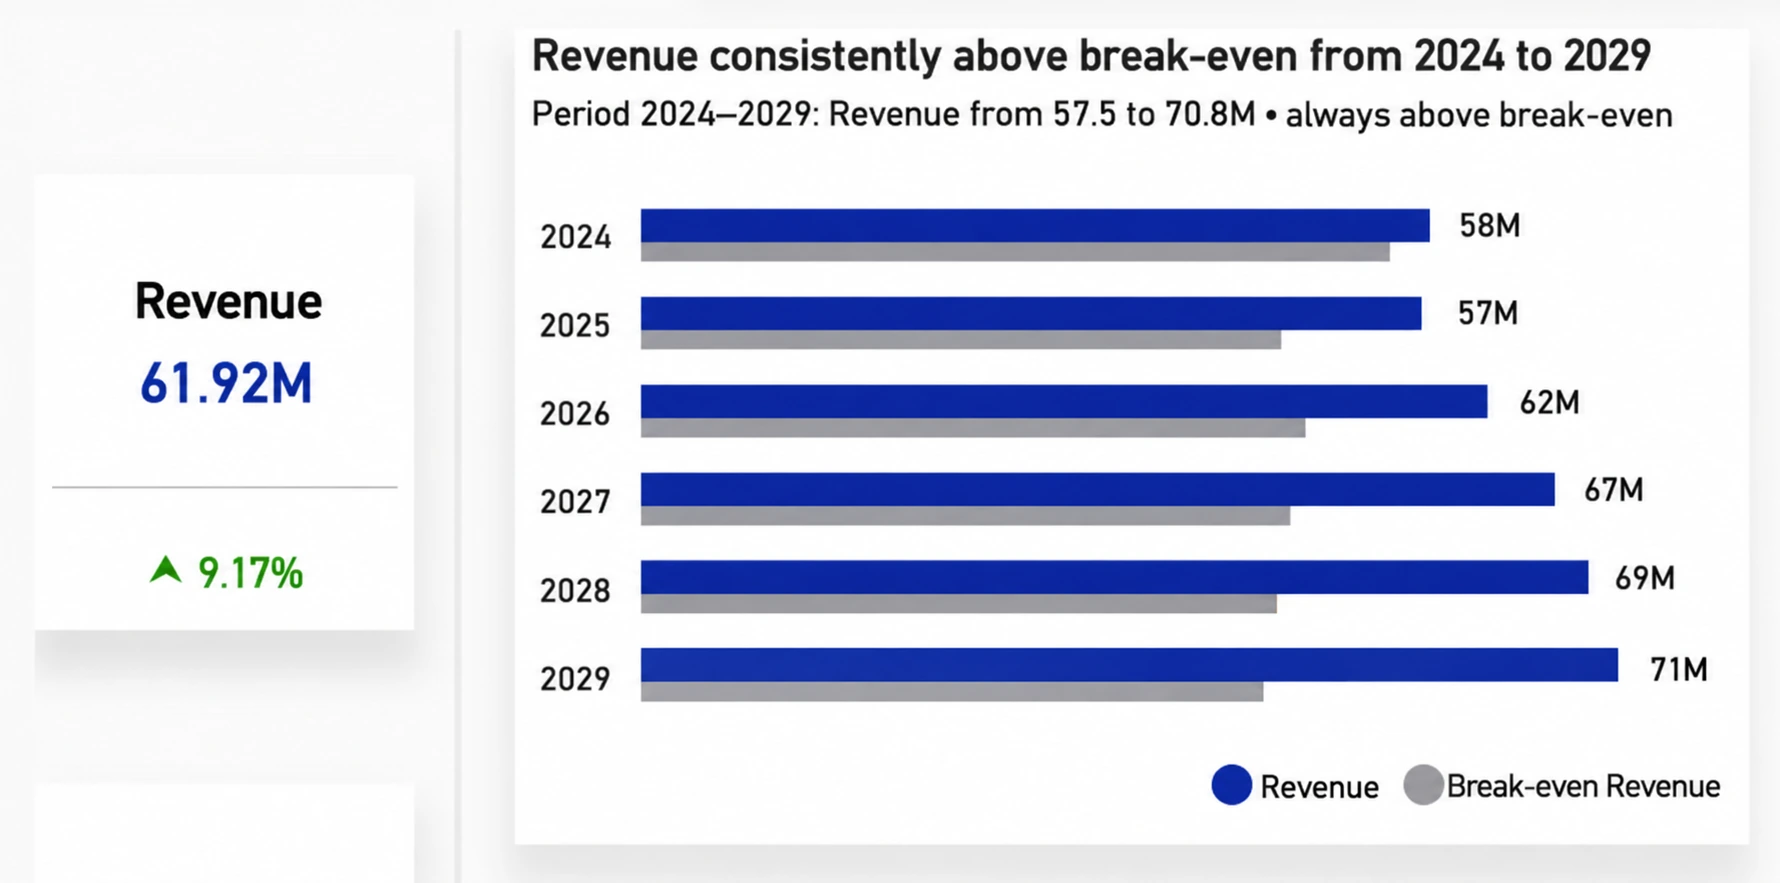
Revenue remains above break-even and shows a steady growth trajectory over the period analysed.
REAL PROJECT
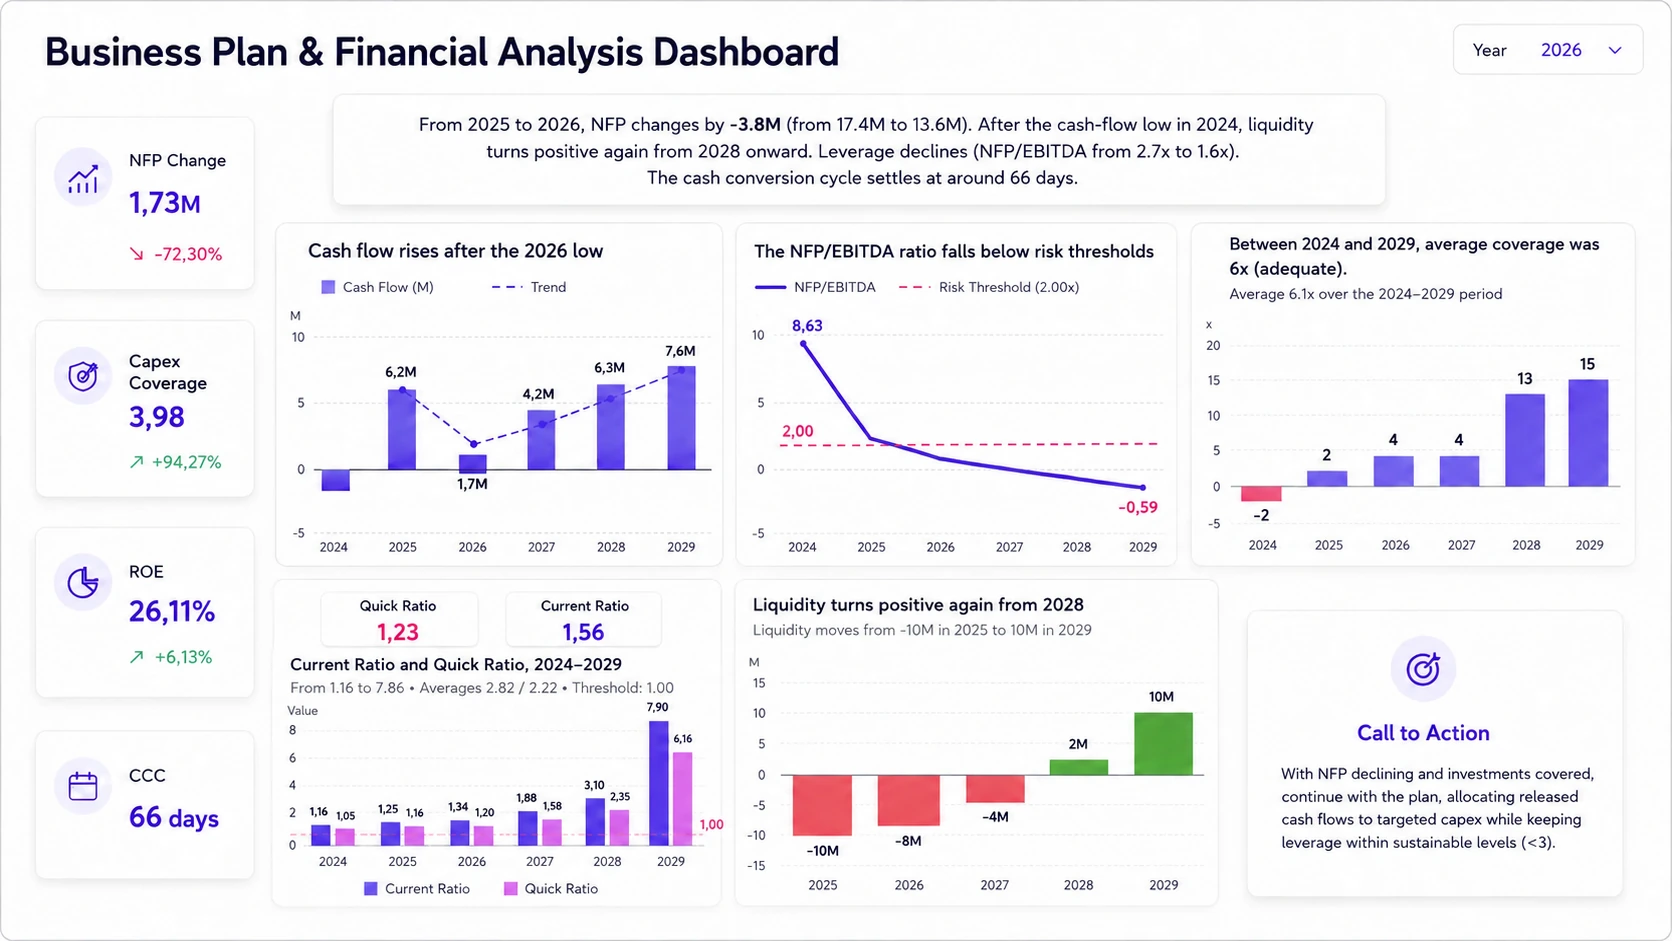
Power BI dashboard developed for an accounting professional as part of the accounting review of a company's business plan. The dashboard brings together revenue, profitability, net financial position, liquidity and investment coverage in a clear executive view to support the analysis and evaluation of the plan.
Executive Snapshot
A summary of the main financial findings: revenue growth, improving profitability, net financial position under control, investment coverage, and a return to positive liquidity.
2026 Revenue
+9,17%
Revenue remains above break-even and shows a steady growth trajectory over the period analysed.
EBITDA
+31,25%
Operating profitability is increasing, confirming an improvement in the economic sustainability of the plan.
NFP/EBITDA
decreasing leverage
The NFP/EBITDA ratio falls below risk thresholds, improving the assessment of financial strength.
Liquidity
positive from 2028
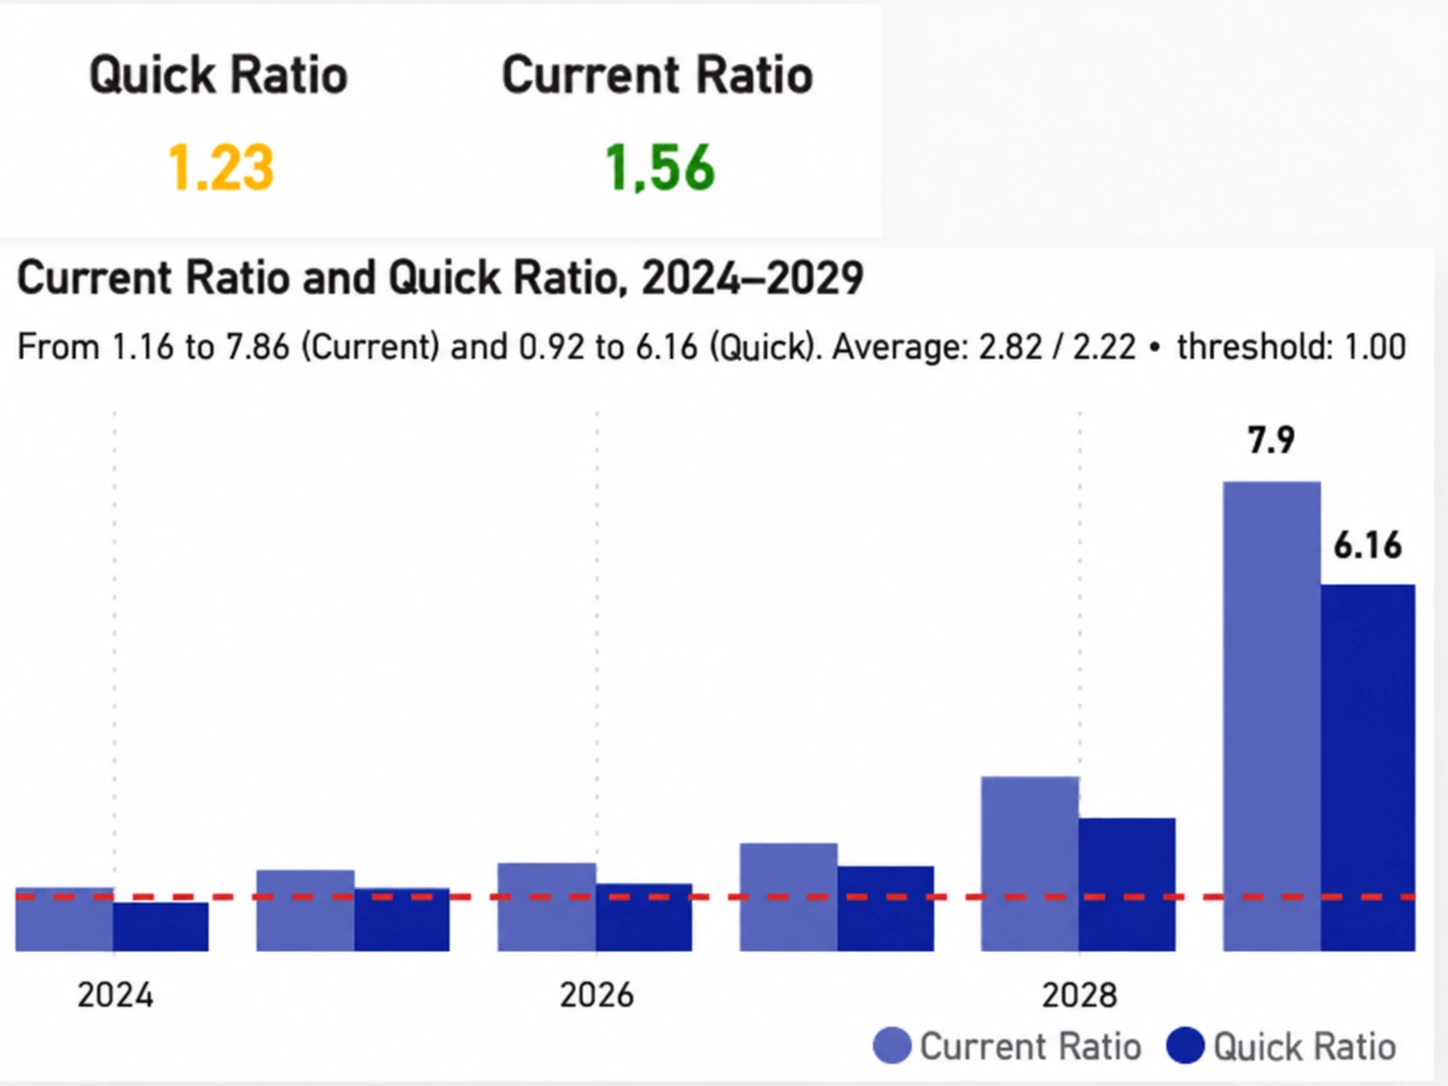
Liquidity turns positive again in the forecast plan, indicating a more balanced cash flow position.
ROE
+6,13%
Return on equity improves, strengthening the economic sustainability of the plan.
CCC
cash cycle
The cash conversion cycle is monitored to assess financial timing and operating funding needs.
Dashboard Preview
The dashboard integrates revenue, break-even, profitability, net financial position, investment coverage, liquidity, and financial ratios into two management views designed to support analysis and decision-making.
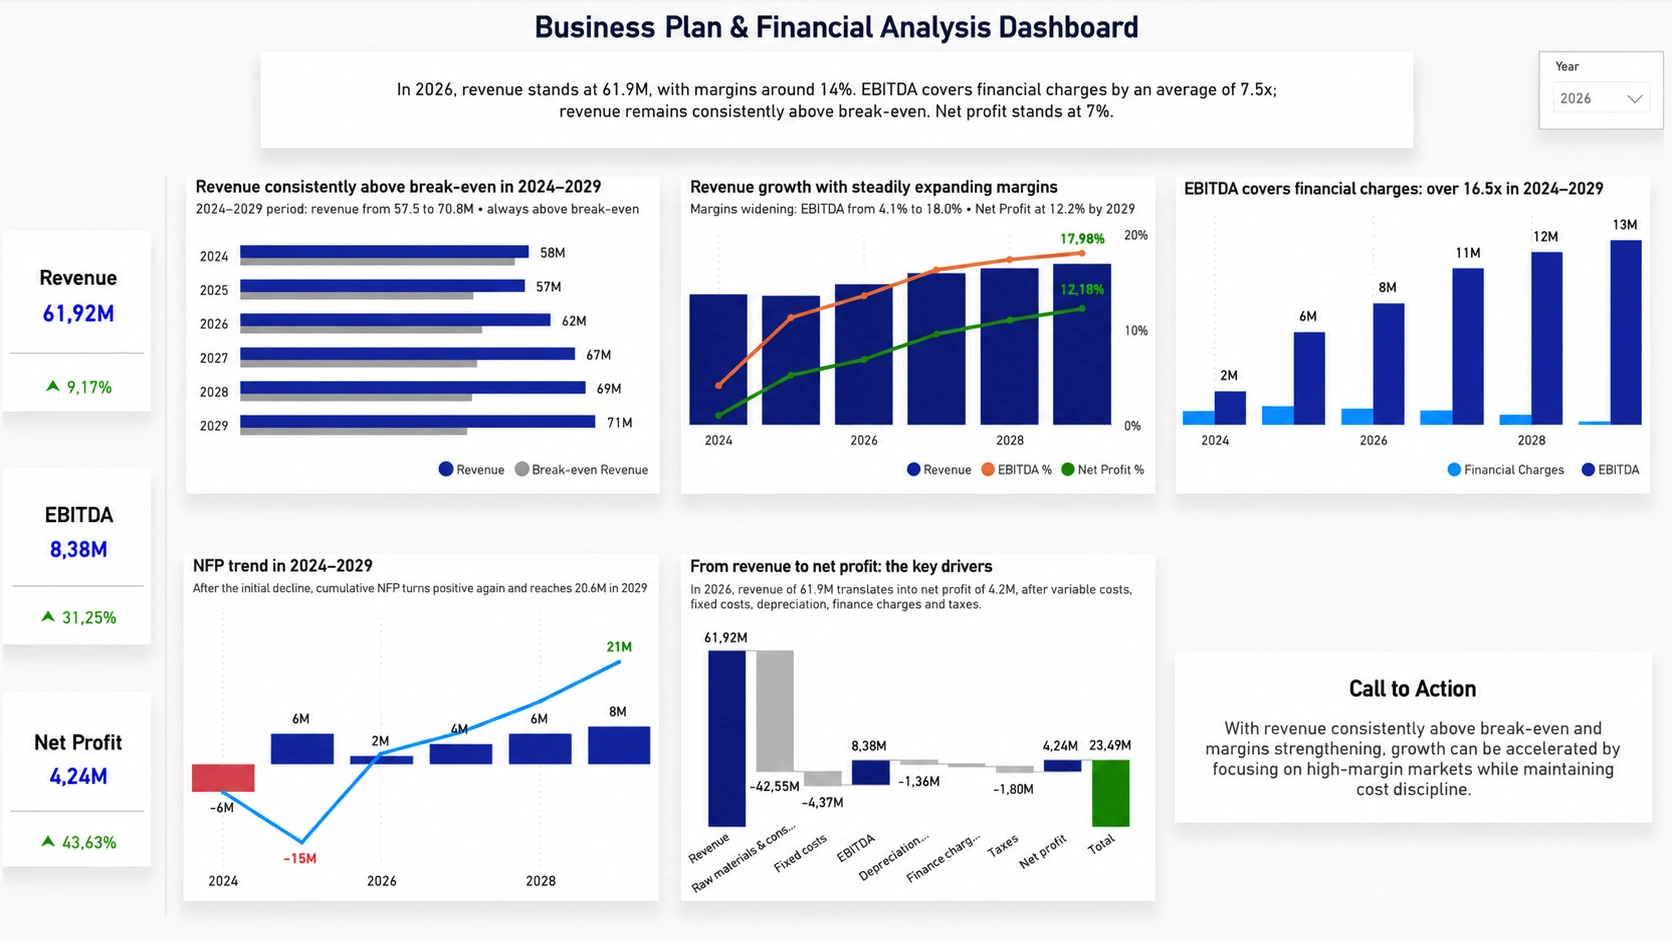
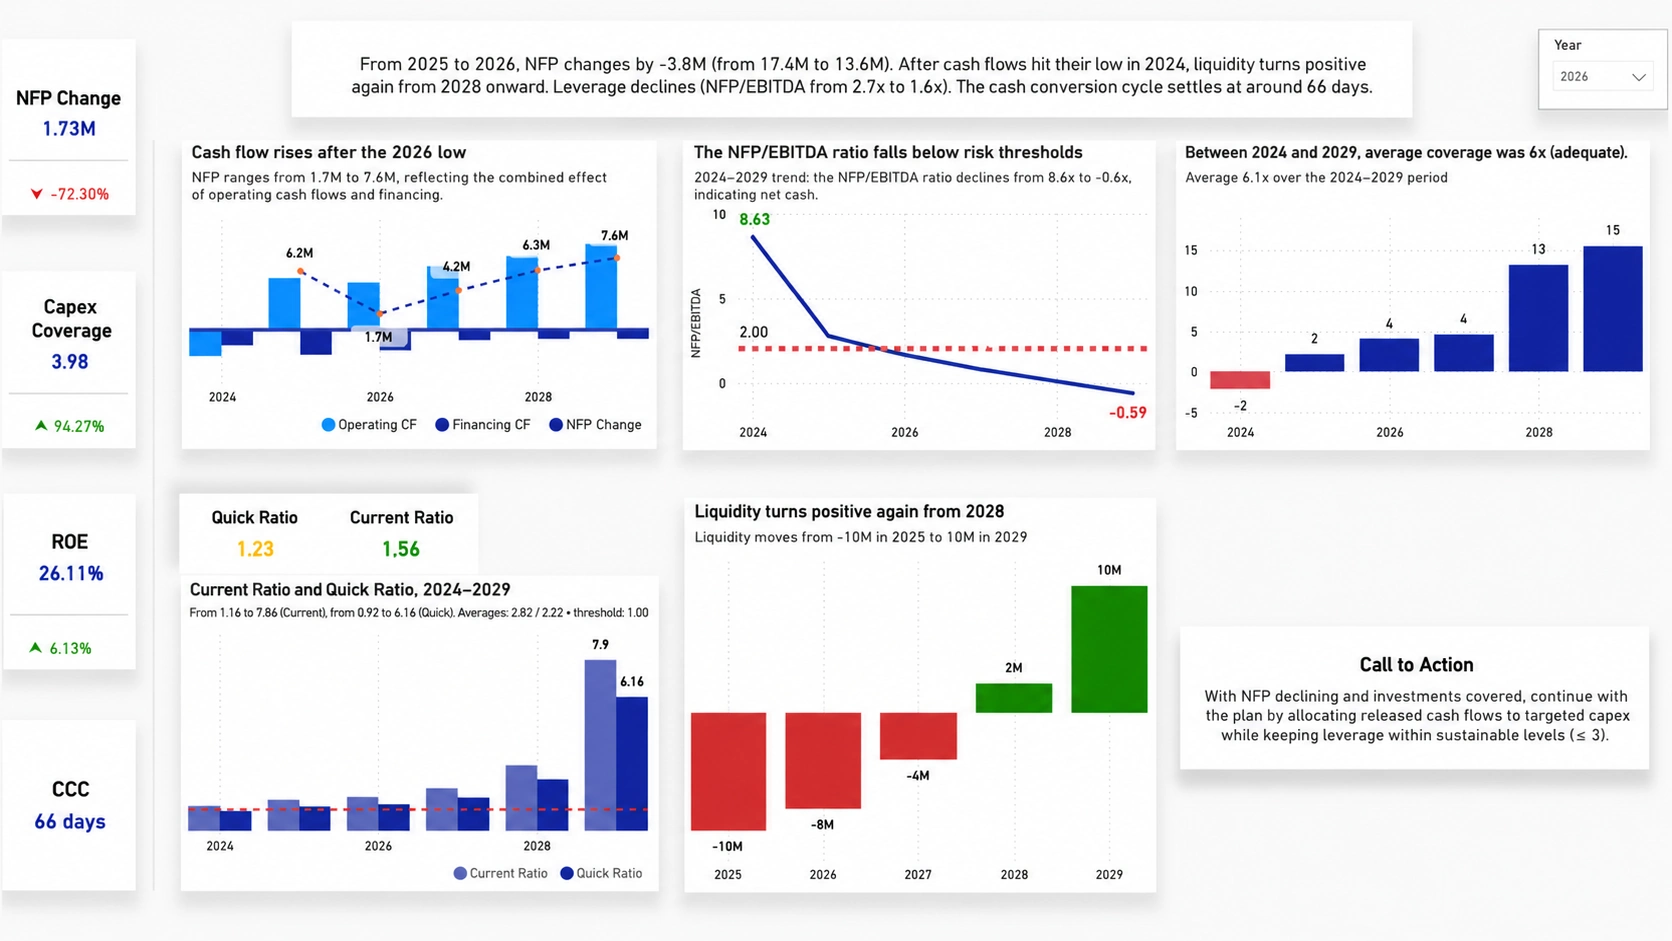
Scroll to change view. Click the dashboard to display it in full screen.
The Context
A business plan cannot be assessed solely through its final revenue figure. Understanding its sustainability requires connecting profitability, financial expenses, investments, net financial position, liquidity, ratios, and cash flows in an integrated analysis.
Business Challenge
The business plan analysis required a view capable of making economic balance, financial sustainability, and investment coverage capacity immediately clear.
Revenue, costs, margins, and net income were spread across complex schedules, slowing down the interpretation of key signals.
It was necessary to monitor net financial position, leverage, Capex coverage, and ratios to determine whether the plan was sustainable over the medium term.
The indicators had to be transformed into a clear, navigable view suitable for review, control, and decision-making.
Analytical Approach
The project was developed through a structured analytical process: from reviewing economic and financial data to defining KPIs and building a dashboard focused on evaluating the plan.
Definition of the key metrics needed to assess revenue, EBITDA, net income, net financial position, ratios, and cash flows.
Forward-looking analysis for 2024–2029 to assess growth, profitability, break-even, and plan sustainability.
Integrated analysis of leverage, investment coverage, ratios, and liquidity to assess financial risk.
Translation of the main financial signals into calls to action and concise recommendations for the decision-making process.
The Solution Developed
The dashboard was designed to provide a management-level view of the business plan by linking revenue growth, profitability, net income, net financial position, liquidity, and investment coverage. The goal is to make the plan easier to read, compare, and use in support of assessments and decisions.
KPI Framework
The dashboard indicators were organised into three analysis areas to connect economic performance, financial structure, and plan sustainability.
Area 01
Measures the plan’s ability to generate revenue, profitability, and net income over the period analysed.
Revenue • EBITDA • Net Income • Margins
Area 02
Analyses debt, net financial position, leverage, and the plan’s ability to support financial expenses and investments.
NFP • NFP/EBITDA • Capex • Coverage
Area 03
Highlights cash balance, forecast liquidity, and financial ratios used to assess the plan’s resilience.
Quick Ratio • Current Ratio • ROE • CCC
BUSINESS PLAN INSIGHTS
The dashboard brings together the business plan’s financial and operating indicators in a comparable view, making it easier to assess growth, profitability, financial leverage, projected liquidity and investment coverage.
0
2026 revenue change in the plan
0
EBITDA change in the plan
0
average Capex coverage, 2024 - 2029
0
projected liquidity in 2029
I create Power BI dashboards to analyse business plans, financial KPIs, profitability, and economic sustainability in a simple, visual, and decision-oriented way.
Free Consultation
Complete the form and briefly describe your needs. I will contact you to understand how to make your KPIs, reports, and dashboards clearer.